Building Forecasts November 2011 – Building Articles
As New Zealand’s population continues to age and the rate of natural increase slows, international migration is set to become an increasingly important factor in population growth. Does the changing make-up of New Zealand’s population have significant implications for household size and, therefore, how many new houses will be needed in the future?
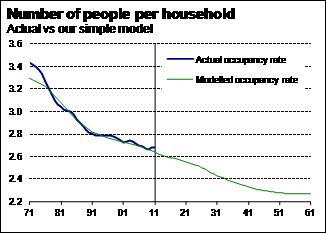
Back in 2004, we did some basic work modelling the occupancy rate, or number of people per household, by examining the age profile of the population. The article [1]showed that, since the mid-1970s, changes in the occupancy rate could be well explained by assuming that:[2]
- all people aged between zero and 19 live with their parents
- all people aged between 20 and 79 live as a couple (with or without children aged under 20)
- all people aged 80 or over live alone.

Graph 5.1
Over the last couple of years, we have also regularly discussed the roles that the lack of new residential building activity and broader economic conditions have played in influencing the occupancy rate. Over a horizon of up to five years, low levels of house building activity can push the occupancy rate above the trend suggested by the age profile of the population. At the margin, a tight supply of new houses forces a higher average number of people to squeeze into every dwelling.[3] This factor helps explain why the occupancy rate is currently quite a bit higher than would otherwise be expected.
But what of migration and the role of ethnicity in influencing household size? The question is not a simple one to answer, as it involves matching an individual attribute (ethnicity) with a household attribute (number of people). Furthermore, the ability of people to identify themselves with more than one ethnicity muddies the waters even more.
The most readily available census data matches household size with the ethnicity of the reference person (i.e. the person in the household who completed the dwelling census form). This data is far from perfect as it does not capture possible different ethnicities of other people within the household. However, combining these figures with data on the age profile of the population by ethnicity gives us some idea of whether ethnicity is a factor that influences household size.
Before presenting the data, it is important to note that we are trying to capture the effect of ethnicity on occupancy rate independent of the different number of children had by people of various ethnicities. Larger family sizes for Maori and Pacific Islanders, in particular, will tend to boost occupancy rates for people of these ethnicities. However, this influence is captured in our standard analysis of the occupancy rate, which incorporates people’s ages as a factor in influencing the number of people per dwelling (ie children are assumed to live with their parents).
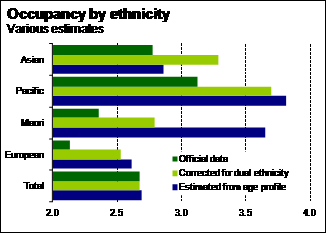
Graph 5.2 shows three different measures of the occupancy rate for the different ethnic groups.
- The official data has been sourced from Statistics NZ. However, this data implicitly overestimates the total number of households by about 18%, mainly due to the option for people to identify themselves with more than one ethnic group.
- As a result, we have scaled down the number of households in each ethnic group to make sure the sum matches the total number of households. The implied occupancy rate given the reduced number of households in each ethnic group is shown by the figures entitled "Corrected for dual ethnicity".
- Finally, we have independent estimates of what the occupancy rate for each ethnic group would be if our standard assumptions about living arrangements by age held uniformly across each ethnic group. This benchmark ("Estimated from age profile") can effectively be compared with the data that has been corrected for dual ethnicity.

Graph 5.2
The largest discrepancies between what we would expect the occupancy rate to be, and what it actually appears to be, are for Maori and Asian households. Given the age profile of the Maori population, we would expect Maori to record an occupancy rate similar to Pacific Islanders, but itis much lower. In contrast, the occupancy rate in Asian households is quite a lot higher than the age profile of the Asian population would suggest.
The following points highlight possible statistical reasons for the variation between the estimated occupancy rate and our expectations of that rate. Given data limitations, we are unable to isolate these factors and correct for them if necessary.
- We have assumed that all ethnicity categories have the same rate of dual response, which may not be the case.
- We have assumed that the reference person provides an unbiased indicator of the ethnicity of other people within the household, which may not be the case.
However, there are sociological factors that may also influence the occupancy rate for different ethnicities. These factors include:
- divorce rates or the incidence of single-parent families
- the relative stage of life of people, particularly in regards to international migrants (egg, during the last 20 years there have been increasing numbers of international students, particularly from Asia, who will not easily fit in the simple model of the occupancy rate we have previously outlined)
- the differing likelihood across ethnicities of extended family members also being part of the household.
The muddiness of the data makes it difficult to draw any firm conclusions about the effect of ethnicity on the occupancy rate or what influence migration may play. However, in looking at population projections over the next 15 years, it is important to note that the fastest growing ethnicities between 2011 and 2026 are expected to be Pacific (up 58%) and Asian (up 39%). With the fastest population growth occurring for those ethnicities with the highest occupancy rates, the nationwide occupancy rate will be kept higher than would be the case if population growth occurred evenly across all ethnicities.
Part of the higher occupancy rates for Pacific and Asian households may be caused by their tendency to settle in Auckland where the price of housing is generally higher. The relatively high cost of accommodation in the city may be a contributing factor in pushing up the occupancy rate for these ethnicities. [4]
So how significant is the ethnic make-up of population growth in determining underlying demand for dwellings? We estimate that the concentration of population growth among the Asian and Pacific ethnicities could reduce underlying demand for new housing by 10% over the next 15 years, or more than 2,000 dwellings per year, compared with a scenario where population growth was evenly spread across all ethnicities.
The likely effect on the overall occupancy rate is barely noticeable. Estimates suggest it could fall from 2.68 in 2011 to 2.56 by 2026 – a figure that might be closer to 2.54 if population growth was more evenly spread. However, those numbers serve to illustrate the importance of changes in the occupancy rate in determining demand for new housing. Seemingly small changes
[1]Middle-aged spread,www.infometrics.co.nzarticle.aspx?id=3212.
[2]Of course, not everybody in these age brackets behaves in thisway, but what our work demonstrated was that the age structure of thepopulation is an important factor determining trends in the occupancy rate.
[3]For more detail see Squeezing together, www.infometrics.co.nzarticle.aspx?id=4860.
[4]To the extent that this factor is important, our articleimplicitly assumes that immigrants will settle in the same areas as otherpeople in their ethnic group live.
Background Drivers ·  Population growth ·  Financing costs ·  Availability of labour ·  Household spending ·  Government spending ·  Tourism ·  Building costs
Residential Building And Property ·  Rents ·  House sales ·  House prices ·  Underlying demand ·  New dwellings ·  Apartments ·  Additions and alterations
Non-Res Building And Property ·  Non-residential prices ·  Miscellaneous building ·  Commercial building ·  Education building ·  Industrial building ·  Accommodation building ·  Hospital building ·  Infrastructure


