Community wellbeing: the next frontier?
Earlier this month, Infometrics economist Brad Olsen spoke at the Economic Development New Zealand 2018 Conference ‘Mahi Tahi’ about how to move towards measuring inclusive growth in NZ’s regions. This article summarises the key points of his presentation.
Measuring economic output and the wellbeing of people in society are vastly different, yet we often conflate the two concepts. Although GDP has long been our measure of success in the economics sector, it doesn’t tell us much about how individuals in their communities are faring. The need to better measure the wellbeing of our communities is rapidly gaining momentum in NZ. Treasury and StatsNZ are working together on Indicators Aotearoa, a statistical framework for measuring wellbeing, and the government has signaled that next year it will introduce the 2019 Wellbeing Budget.
Infometrics is committed to ensuring local agencies understand wellbeing in their communities. That’s why we are developing a robust and comparable way of measuring wellbeing throughout NZ’s regions.
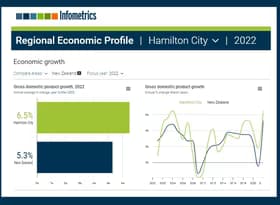
At Infometrics, we have proven expertise in constructing robust and insightful regional frameworks so that clients can understand how their local area is performing, primarily though our Regional Economic Profiles and Quarterly Economic Monitor .
We also have considerable expertise in regional wellbeing frameworks. In 2016 we developed a Prosperity Index, which measures broader economic prosperity or wellbeing within and across communities. This culminated in a wide-ranging report for Auckland Tourism, Events, and Economic Development (ATEED) which measured prosperity across Auckland’s 21 local boards. As an extension of this work, we also profiled the South Wairarapa District and communities within this area. We measured economic prosperity or wellbeing in each part of the district in five domains: economic quality, household prosperity, connectedness, skills and labour force, and demography.
Over the years we’ve started to look at how we can measure success more broadly at a regional level, and recent moves to measure wellbeing nationally has spurred us to make this space a priority. As a result, we are building on our work from the Prosperity Index to deliver an engaging and insightful tool to our regional clients in 2019. This tool will allow clients to measure wellbeing and inclusive growth at a territorial authority and regional level, with comparisons across areas.
A key consideration for developing a wellbeing framework is which indicators to include. For example, are they consistent over time, so that we can continue to measure them, and update them as more data becomes available? Are they statistically robust, so that we can know that the story the data is telling is realistic? And most importantly, does the data inform us about relevant topics? For example, GDP does allow us to measure distribution of economic growth, but instead household income might grant us a better insight.
In this section I look at an example of some indicators which we’re considering including in our framework. These indicators focus on three areas – the past, present, and future – which allows us to measure how we’ve got to where we are now, what’s the current state of affairs, and what will the future of a community look like?
Looking to the past, crime figures can help to establish the proportion of individuals and families who are in need or disconnected from their communities. As an example, Police crime data for Whāngārei shows that crime on a population adjusted basis is growing, as a result of more thefts.
Graph 1

From the literature we know that often those caught stealing are either looking to support themselves or others, or at the very least are disengaged from society. Measuring crime rates allows us to better understand where issues may lie, and what areas might need greater support and targeted interventions.
Looking at the present, household income is an important consideration for understanding the ability of households to meet their material needs.
Graph 2

Looking at household incomes in Auckland, there are clear differences in the ability of households in different areas to meet their costs. Again, the ability to measure household income allows us to better understand which areas are in need of greater assistance, and identifies which areas are doing well, and why, so that we might replicate their success elsewhere.
Finally, to examine wellbeing and inclusive growth in communities, we must look to the future, both so that we know where we’re heading, but also so that we can identify obstacles ahead of time and put in place actions to address issues before their impact is felt. For example, it will be increasingly important to understand where our aging population may impact us most.
Graph 3

NZ’s aging population is well understood, but just where the concentrations of this will be are not. The dependency ratio allows us to better understand the burden the working age population will need to shoulder relative to those outside of the working ages. Here we can see that Masterton and Horowhenua Districts face some of the greatest impacts from an aging population over the next nine years. Such insights allow decision makers to adjust policy settings ahead of time.
Yet all these indicators are insightful but lack a common thread through which we can determine how an area is doing. Is the community better off if crime is up, but household incomes have also increased? Instead of just looking solely at each indicator, Infometrics has built a framework to structure insights into understandable domains. This approach, which was a key component of our previous Prosperity Index work, will be overhauled and expanded to allow for across-the-board analysis of the four capitals (in the central government framework) and the four wellbeings (in the local government framework).
Measuring inclusive growth throughout NZ’s regions and territorial authorities will involve discussions between Infometrics and our clients to better understand what clients are interested in measuring, and why. Feel free to get in touch with Brad to talk more about the work Infometrics is doing to measure inclusive growth and wellbeing across the regions, by emailing him at brado@infometrics.co.nz