From the beach 2013
Four years ago, in our From the beach preview for 2009, we compiled a set of “recession indicators”. We believed these indicators would provide good leads on near-term prospects for the economy, enabling well-informed businesses to take advantage of the economy’s next upturn. We’re still updating our recession indicators – clients can see them here. Back in 2009, we were not envisaging such persistently weak economic conditions, including another recession in the second half of 2010. On a per-capita basis, economic activity is still 2.2% below its 2007 peak, the unemployment rate is yet to turn around, and the average person on the street is still talking about “the recession” even though the economy has been consistently growing for the last two years.
The extended period of poor growth and spare capacity in the economy is creating an environment where few are going to believe things are getting better until the worm has already turned. Investment intentions are only just above average, despite spending on plant and machinery during the last year still being down 8.6% from its 2007/08 peak. Much the same can be said of employment intentions, which is bad news for workers given the unemployment rate is up at 7.3%.
Canterbury has got its rebuild, which is showing some signs of progress, but is anything going to shake the rest of the country out of its malaise this year?
In our view, the major key still lies with export prices, which help encapsulate the state of the international economy and its effect on aggregate income within New Zealand. The lack of momentum in provincial economies currently reflects the drop in prices that occurred throughout much of 2011 and 2012. ANZ’s commodity price index in New Zealand dollars recorded a 26% drop in returns to exporters between March 2011 and August 2012. The index has rebounded almost 5% since then, but that’s not enough to significantly boost spending and investment activity in the provinces.
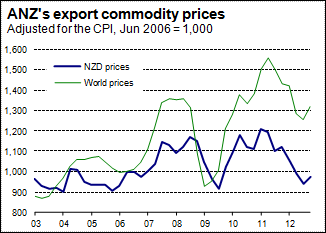
Graph 1
So far, the recovery in export prices has been largely limited to the dairy sector. If you’re looking for early signs of recovery, then the most dairy-intensive regions, and perhaps the first to get going, are the West Coast, Waikato, Taranaki, Southland, and Northland.
The other major issue looming for the domestic economy this year is the housing market and, most particularly, the Auckland housing market. After adjusting for consumer price inflation, real house prices across the Auckland region are now just 2.4% short of their 2007 peak. In the former Auckland City area, real prices have now passed their peak from before the Global Financial Crisis.
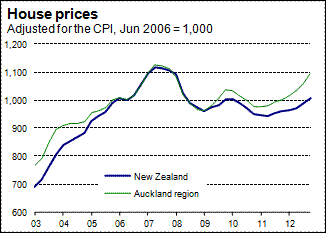
Graph 2
Housing affordability and the imbalance between the demand and supply of new houses in Auckland have re-emerged as hot topics over the last few months. Residential consent numbers have been rising for over a year, but growth petered out in the second half of 2012 and Auckland’s annual consent total is still 14% below its decade-long average. The lack of a sufficient supply response to date means that the Reserve Bank faces considerable risks around the outlook for Auckland house prices. Further acceleration in house price inflation in the region could have flow-on effects for the Bank’s expectations of spending growth, its required monetary settings, the perceived sustainability of near-term economic growth, and expanding debt levels.
Speaking of debt levels, we actually see the pick-up in lending growth over the second half of 2012 as a positive sign for the New Zealand economy. Throughout 2010 and 2011, the lack of lending growth signified a palpable lack of confidence among economic players. The September 2012 quarter was the first time since March 2008 that we have seen positive growth in the real stock of debt across all of the four major lending categories.
Of course, the lift in debt levels could also be symptomatic of disappointing economic conditions. Farmers are taking on more debt to shore up their cash flow in the face of the fall in commodity prices since early 2011. Businesses may also be addressing cash flow issues given the lack of growth in spending activity. Households are taking on more debt given the weak labour market and poor income growth. However, this glass-half-empty interpretation is still better than the alternative of falling debt levels – that trend would suggest an expectation that the sluggish economic conditions will not change in the foreseeable future, so tiding your farm or business over in the short-term through an increase in borrowing would not be a viable option.
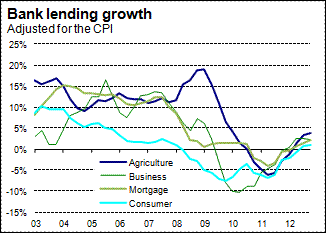
Graph 3
The acceleration in lending growth is also consistent with easing credit conditions and the lower funding costs that we have seen during the second half of 2012. Credit default swap rates, a proxy for the cost of international funding for Australasian banks, ended last year at their lowest level since April 2011 and look set to dip to three-year lows in coming months. Europe’s financial market problems are becoming less critical and the positives may be starting to flow through into the New Zealand economy.
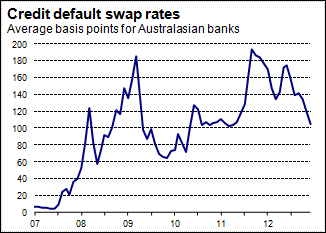
Graph 4
The upshot is that New Zealand remains largely at the mercy of events overseas, but the intense uncertainty is easing. This reduction in extreme risks is leading to more favourable outcomes in both commodity and financial markets. New Zealand’s GDP growth is only expected to be in the 2.5-3.0%pa range during 2013, but that result would still be the best in almost six years. So short of another meltdown somewhere in the world economy, we are increasingly hopeful that a more noticeable recovery in the New Zealand economy is on its way.
