Is petrol price pain all it’s cracked up to be?
Petrol prices have risen substantially over recent years. According to Statistics NZ’s Consumers Price Index, the price of petrol rose by 83% between March 2005 and December 20131, while general consumer prices rose by 25% over the same period. At face value this petrol price increase appears to be a severe burden on households but, how much has improved fuel efficiency helped to soften the blow?
The underlying price of petrol is not the only contributor to households’ petrol expenses; the fuel efficiency of vehicles also plays an important role. Furthermore, aside from these petrol costs, the affordability of using your car is also affected by depreciation and the cost of repairs and compliance, as well as personal income levels. Over recent years, favourable movements in the majority of these other factors have helped mitigate the effects of rising petrol prices. The remainder of this article discusses each of these contributors to vehicle affordability in turn.
The fuel efficiency of the New Zealand vehicle fleet has risen significantly over recent years. According to data from the Ministry of Transport, average fuel consumption rates of new petrol-fuelled vehicles entering the New Zealand car fleet dropped by around 2.9%pa between March 2005 and December 2012.
Part of the explanation for the improvement in average fuel consumption is that technological advances have increased the underlying fuel efficiency of vehicles. For example, the average fuel efficiency of cars under 1,300cc rose by 0.6%pa over the nine years to December 2012. Meanwhile, the biggest efficiency gains were recorded for cars between 3,000cc and 3,999cc, improving by 1.9%pa.
However, these technological advances are still not a complete explanation for the substantial improvement in the average fuel consumption of new vehicles’ entering the New Zealand car fleet. The other part of the explanation for lower average fuel consumption is that sales of small cars (less than 1,600cc) have risen relative to demand for larger gas guzzlers. During 2005, small cars comprised 16% of total new car purchases, but by December 2012, small cars’ share had risen to 29%.
This increased demand for small cars has been in direct response to higher fuel prices, as well as reflecting more conservative spending patterns of households and businesses in the wake of the Global Financial Crisis. Car manufacturers have responded to this shift in demand by expanding their range of smaller cars and including features in them that have historically been reserved for larger vehicles.
The improvements to fuel consumption discussed above are best put in perspective by calculating an augmented petrol price index. Graph 5.1 shows a petrol price index that has been adjusted to take into consideration the offsetting effects of better fuel consumption of new vehicles entering the fleet. Unadjusted petrol prices and general consumer prices have also been graphed for comparative purposes.
Taking into consideration fuel consumption shows that fuel costs for the typical new car rose by a moderate 45% between March 2005 and December 20132. Of course, households that were still running the same car in December 2013 as they were in March 2005 would have faced the full brunt of the 83% lift in underlying petrol prices – implying that the true increase in fuel costs for households lies between these two figures.
Graph 5.1
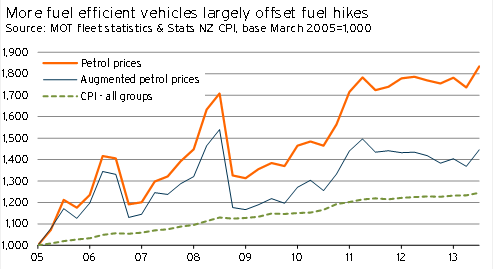
However, the augmented petrol price index does give a good indication of the running costs of new cars entering the fleet through time. The augmented index shows that the lift in fuel costs for the typical new vehicle from 2005 to 2013 only moderately outstripped increases in overall consumer price.
What about other vehicle running costs?
Aside from petrol expenses, the other key costs of running a car include servicing, repairs, and parts. Graph 5.2 shows these servicing and repairs costs, as well as the cost of parts, and compares these costs to general consumer price movements.
Graph 5.2
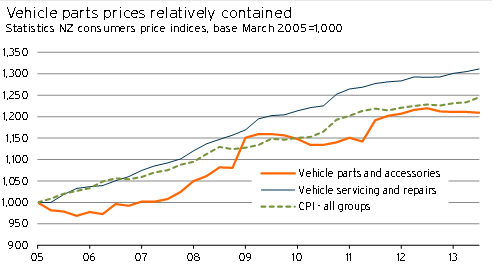
Over recent years, the elevated New Zealand dollar and spare manufacturing capacity in Asia have helped keep a lid on the prices of imported parts and accessories. Between March 2005 and December 2013, the 21% increase in the price of vehicle parts and accessories was smaller than the 25% lift in general consumer prices. Other servicing and repair costs (ie excluding parts) rose by a slightly swifter 31% over the same period, reflecting general trends in non-tradable prices.
Outside of these maintenance costs, other vehicle running costs include insurance and compliance costs. Data from Statistics NZ shows that the price of vehicle insurance rose a modest 24% between March 2005 and December 2013. Compliance costs climbed more rapidly, with the price of other private transport services (including warrant of fitness and registration costs) rising 41% over the same period.
What about depreciation?
Having talked about fuel costs, maintenance expenses, insurance, and other compliance costs, we will now turn our focus to depreciation – the biggest cost of all when it comes to owning a vehicle. For business purposes, the IRD prescribes a straight-line depreciation rate of 21% for new passenger vehicles. On a $50,000 vehicle, this rate implies a whopping $10,500 depreciation expense per year.
Luckily for motorists, depreciation expenses have not risen much over recent years due to extremely benign movements in the cost of both new and used imports, as demonstrated in Graph 5.3.
Graph 5.3
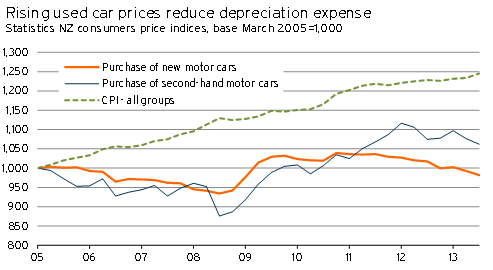
Graph 5.3 shows that between March 2005 and December 2013, the cost of new cars eased by 1.8%, while used car prices rose by a mere 6.2%. These price movements are far less than the increase in general consumer prices, and helped contain the cost of vehicle depreciation.
Considering ability to pay
It’s all very well considering what has happened to the underlying cost of running and owning a vehicle, but it is also important to look at consumers’ ability to pay for these motor vehicle expenses. This ability to pay is highly dependent on income levels.
Graph 5.4 shows what has happened to average hourly wages over the past nine years, and compares wage movements with the augmented petrol price index from earlier and general consumer prices.
Graph 5.4
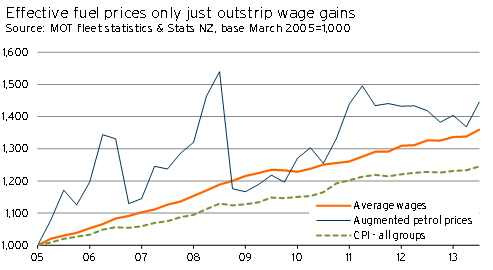
The graph clearly shows that, although augmented petrol prices outstripped wage growth between March 2005 and December 2013, the gap between the two series is not great. Furthermore, considering that the 36% wage growth over this period exceeded changes in the cost of vehicle parts and accessories, servicing, insurance, and depreciation, there does not appear to have been any significant overall deterioration to vehicle affordability.
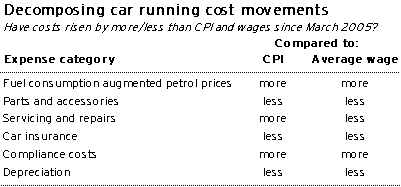
Table 5.1 decomposes these movements in affordability further, showing whether each expense category has increased by more or less than movements in consumer prices (the CPI) or average wages between March 2005 and December 2013.
Table 5.1
1 This article uses the 2005-2013 time period due to a lack of fuel consumption data from before 2005.
2 Average fuel consumption statistics for new vehicles entering the fleet were not available for 2013, so our estimates conservatively assume that average fuel consumption remained at its 2012 level.