How prosperous are South Wairarapa’s main towns?
An Economic Prosperity Index (EPI) is an increasingly common tool for assessing regional living standards and is a complementary indicator to GDP growth. This article provides a case study for South Wairarapa, measuring prosperity in its three main towns: Greytown, Martinborough and Featherston. The analysis reveals some challenges that policymakers will need to face, including low skill levels in Featherston and the ageing population in Greytown.
Infometrics has recently compiled EPIs for a number of local authorities to help them measure prosperity across their district. The EPI is a composite indicator which measures economic prosperity across five domains: economic quality, connectedness, skills and labour force, demography, and household prosperity [1].
Greytown’s EPI score is the highest
The EPI shows that Greytown has the highest economic prosperity of the three main urban areas in the South Wairarapa District. Its overall score of 6.3 out of 10 is higher than Martinborough (5.5) and Featherston (3.7).
Detailed analysis of the contributors to prosperity in each town is shown in the accompanying infographics:
So why does Greytown come out on top?
As the graph below shows, Greytown outperforms its peers in four of the five domains. Greytown’s residents work more commonly in knowledge-intensive industries (Economic Quality domain), the town has good transport linkages and internet access (Connectedness), its residents are well-educated and skilled (Skills & Labour Force), and Greytown’s households enjoy comparatively high incomes and wealth (Household Prosperity).
Graph 1: Economic Prosperity scores
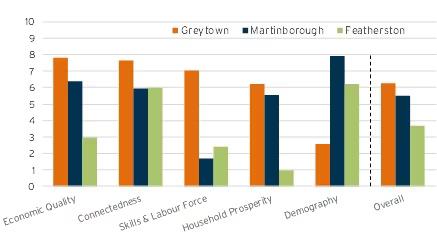
Greytown’s Economic Quality score is 7.8, its highest score across the five domains. Within this domain, it scores 10 for having high employment in knowledge-intensive industries [2] (32% versus the district average of 25%) and for having low employment in declining or ‘sunset’ industries [3] (1.5% versus the district average of 2.3%).
The only domain where Greytown doesn’t rank first is Demography. Its population only grew by 1.3% in the year to June 2017, lower than Martinborough’s figure of 2.5% and the average for the district of 1.5%. Greytown’s dependency ratio [4] of 84% is also relatively high and is projected to increase to 90% over the next decade. A high dependency ratio puts a burden on younger people to finance the older generations.
However, the older age profile in Greytown also helps to explain a strong Household Prosperity score. In particular, Greytown’s home-ownership rate of 79% is significantly higher than Martinborough (71%) and Featherston (69%). Older people are more likely to be wealthier and own their own home. In turn, that brings benefits from stable living conditions.
What does this tell policymakers?
In an ideal world, policymakers would be able to put resources into improving all aspects of prosperity in each town. However, resources are limited and therefore need to be targeted where there is the greatest need. An EPI helps to reveal these needs – either in isolation, or when considered across a broad range of indicators.
For example, in South Wairarapa, Featherston clearly lags behind on Economic Quality. To turn that around, there could be a focus in future on increasing the proportion employed in knowledge intensive industries.
To achieve this, attention is required on improving the indicators within the Skills & Labour Force domain, such as educational attainment and attraction of skilled workers from outside the district. At present, 51% of Featherston’s 24-34 year olds have at least an NCEA level 4 qualification, significantly below 61% for Greytown. Higher skills and better jobs would flow through into improved household incomes in Featherston.
For Greytown, the current position is strong, but it may not always be that way. The challenge here is to counter the ageing population (which will eventually erode the resilience of the town’s economy) by attracting more young people. This will require a vibrant business environment and attractive job opportunities, as well as cultural and leisure opportunities.
The future is EPI
The EPI framework can be applied to identify strengths and weaknesses in any part of the country, and it allows policymakers to look at high-level geographical areas or very detailed local splits. Prosperity variables can be looked at in aggregate or in isolation – as noted above, a focus on, say, educational attainment will tend to improve outcomes in other EPI domains. Regular updates can also be made to monitor progress through time.
Local authorities around New Zealand have used our EPI framework to address various policy questions, for example identifying which parts of a district are most vulnerable to a rise in their council rates bills.
[1] The overall economic prosperity score is an average of the scores across five categories or domains. Each domain contains individual indicators, scored out of 10 (10 is best; 0 worst). We have looked at a total of 16 individual indicators spread across the five domains. For a town to have an overall score of 10, it would need to have a score of 10 for each domain. Within each domain, the town would also need to be the highest scorer in the district for each of the individual indicators. More detail on the technical aspects of our economic prosperity framework can be found at this link .
[2] Examples are medicine and law.
[3] Examples are mining and textile manufacturing.
[4] People aged 0-14 and 65+ relative to those aged 15-64.