What is going on with the labour market recovery?
The New Zealand labour market has been changing, with the type of work available in 2014 very different to the types of jobs and tasks workers would have performed in 1993. In this article we outline some of the changes that have occurred on an industry basis and hazard a guess as to why.
A lot has been made of the labour market returning to “normal”, with the unemployment rate easing back and labour force participation elevated. However, these broad aggregates only tell us part of the story.
New Zealand’s labour market and economy have undergone a series of structural changes in recent decades. In order to understand where the labour market has gone, where it is going, and what these changes mean for the broader economy, we need to understand which “shocks” have had a dominant effect on labour market outcomes.
We can list the primary shocks to the New Zealand labour market as follows.
Globalisation/foreign subsides: Increasingly integrated global markets have made hubs of production more and more important – with individual regions able to specialise significantly. This trend has changed demand for goods and services made in New Zealand both within New Zealand and overseas – as increasingly we have become part of a larger global supply chain.
Graph 5.8
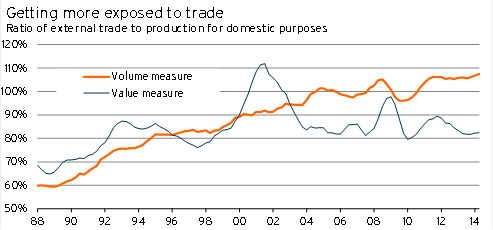
The increasing importance of global trade in terms of the volume of activity is shown in Graph 5.8 – which compares the ratio of exports plus imports (domestic production for foreign use and foreign production for domestic use) to consumption and investment minus imports (domestic production for domestic use). The significant increase in the volume of trade shows how much more important trade with the rest of the world has become for New Zealand.
Supply-based technological change (eg, automation): This type of shock involves changes to the technology used to create goods and services – specifically forms of “labour-saving” technology such as ICT and robotisation.
Demand-based technological change: These types of changes correspond to two main shifts, online retailing and the change in the types of goods and services that households are purchasing.
Labour market policy change: Direct changes to employment laws by government.
Income redistribution policy: Changes to the tax-benefit system, which influence patterns of demand by households as well as the type of work that firms view as valuable.
These different shocks are not mutually exclusive, and we cannot identify which ones are more important than others by giving the data a cursory look. However, we can use these categories to try to understand changes in the composition of employment in the labour market, and to work out what may be “normal” going forward.
For the following discussion we have aggregated up industry-level data into only seven categories: manufacturing, construction, wholesale trade (including transport and storage), retail (including accommodation and food services), private services (made up of finance and insurance, real estate, and other private services), public services (made up of public administration, education, and health), and an “other” category (includes information technology and recreation and arts).
Table 5.3
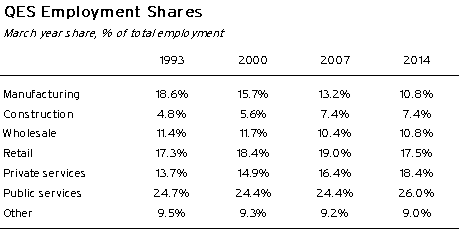
Table 5.3 shows the share of total employment in each of these broad industry categories according to the Quarterly Employment Survey (QES).
The QES is a survey of businesses. It excludes agricultural employment and some forms of self-employment, and as a result it gives us a biased picture of the labour market – albeit one that relates more to our view of wage and salary earners (and thereby labour demand by capital owners) than a more comprehensive measure would.
The Household Economic Survey is a survey of households, and as a result includes these other forms of employment. However, following changes to industry classifications, the HES industry-level data now only goes back to 2009 – and so we are not going to use that series here.
Another useful series is the Linked-Employer-Employee database (LEED). Our regional economic modelling uses LEED data, along with other data sources, to estimate employment at a regional level. Furthermore, using empirical analysis and other partial data sources, our regional economic product is able to provide employment figures up to the current day – when the LEED data is usually at least a year out of date.
For the same industries, our regional data suggests the shares shown in Table 5.4.
Table 5.4
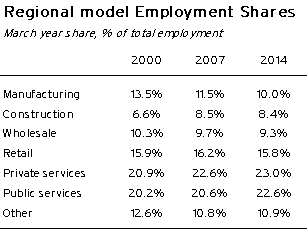
This breakdown would allow us to dig further into the industry changes, identifying which regions have been most affected by the trends we will discuss below. However, we are not going examine that detail here, instead focusing on the broad national trends. A discussion of regional trends is available as a separate product.
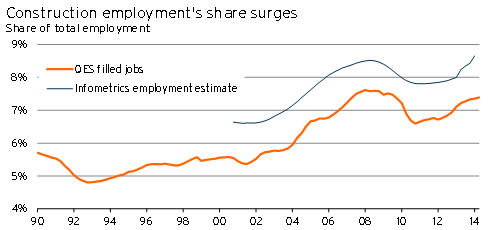
Comparing construction employment now to prior to the 2008/09 recession suggests that the industry is back to normal after a period of weakness. According to the QES, in the June 2014 year, 7.4% of filled jobs were in the construction industry. This proportion was the same as in June 2007, and up from a low of 6.6% in December 2010.
On the face of it, these figures seem a little strange. New Zealand is in the midst of rebuilding Christchurch following on from the devastating 2010/11 earthquakes. Furthermore, house prices are elevated and there is a concerted effort to boost residential building activity in Auckland. In such an environment, construction employment would be expected to take up a disproportionally large share of total employment.
However, adding a bit more historic context makes the current employment result look significantly stronger.
It appears that New Zealand has experienced two booms in construction-related employment: The first was during 2003-2007, when a period of easy credit and large net migration inflows drove a sharp increase in construction employment as a share of total employment. The second has been the period of rebuilding following the devastating Canterbury earthquakes.
On the face of it, these figures suggest that the current level of construction employment relative to total employment is unsustainable, and future employment opportunities in this sector will be limited. However, the million-dollar question is around timing – when is it likely that demand for construction workers will ease?
Graph 5.9
There are two important points to consider here:
- The first point is the rebuild, undersupply, and the nature of current building. Our current forecasts include the Canterbury rebuild, Auckland Housing Accord, and a general undersupply of residential property in Auckland. In this context, there is significant scope for construction activity and employment to run at an elevated level for a prolonged period of time – further out than the end of our current forecasts (March 2017).
- The second point is demand for non-tradables in a globalised world: Globalisation involves the creation of value chains that stretch along countries, linking tradable goods and making their production more efficient – often reducing the employment required. The income boost associated with this, and the surplus of labour, implies that it may be “sustainable” for construction employment to stay as a higher percentage of overall employment – as construction is a non-tradable good, and the buildings that are constructed are in demand by those who are selling goods in the global marketplace.
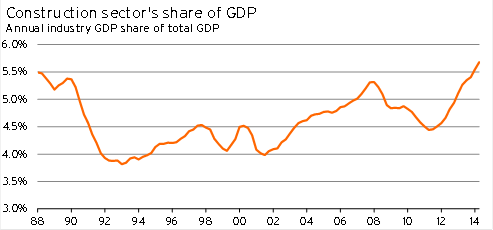
Although construction employment has risen in the past two years, the lift has been dwarfed by the increase in measured construction GDP – implying that value-added in the industry has risen sizably (see Graph 5.11).
During the construction downturn following the Global Financial Crisis, construction firms were avoiding firing staff. As a result the rebound in activity is partially a recovery in productivity levels to their pre-crisis levels.
According to Statistics NZ, measured labour productivity between 1996 and 2012 in the construction industry rose at a rate of 0.5%pa, well below the average annual increase of 1.6%pa recorded over the general economy.
However, in recent years, implied productivity in the construction industry has surged past its pre-crisis levels, with construction sector labour productivity (relative to the economy as a whole) now at its highest level since December 2003.
The sharp lift in labour productivity is, at first glance, surprising. Rising demand for construction and construction services would, all other things being equal, drive down measured labour productivity in the industry.
Graph 5.10

Graph 5.11
However, there are two key reasons why productivity has risen in the way that it has. Firstly, Westpac has suggested that construction employment may be undercounted (and therefore productivity would be overstated) – a view our regional employment model supports, given the importance of self-employed contractors. Secondly, as construction firms and the Reserve Bank have discussed, the Canterbury rebuild would be relatively capital intensive due to the fact that a lot of activity is occurring in the same place.
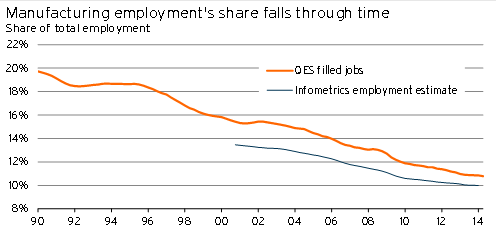
The manufacturing sector has become gradually less important for overall employment over the past 25 years. In late-1989, manufacturing accounted for 20% of all jobs measured by the QES. By early 2013, employment in this sector had fallen below 11% of filled jobs.
Over the decade to June 2013, overall employment in the manufacturing industry declined by 28,745 jobs according to the LEED data. The key drivers of the decline in manufacturing jobs were textiles and footwear manufacturing (with job numbers down by 9,528), wood, paper, and printing (down 8,895), and furniture and other manufacturing (down 4,263).
Graph 5.12
All three of these areas of manufacturing have been subject to intense competition from overseas, as parallel importing and online shopping have increased the competition faced by these types of manufacturers. Furthermore, significant investment by developing economies into manufacturing capacity for these types of goods has also boosted the availability of low-cost supply from trade partners.
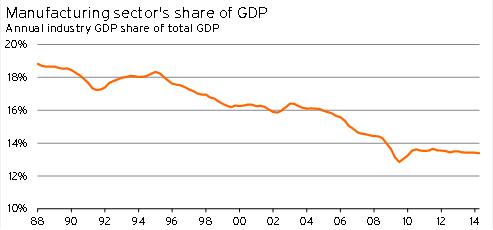
Manufacturing as a share of the New Zealand economy has been in decline for a long period of time, falling from 18.8% of economic activity in March 1988 to a low of 12.8% in September 2009.
Graph 5.13
However, the manufacturing activity that has remained has become more productive. Manufacturing sector labour productivity has gradually ticked up in recent decades according to Statistics NZ, rising at an average annual rate of 2.0%pa between 1996 and 2012 (compared to the 1.6%pa lift in economy-wide labour productivity during this period).
Graph 5.14
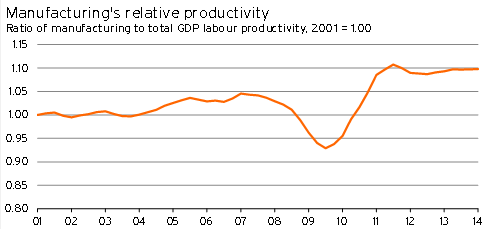
Recent implied productivity numbers indicate that there has been a significant surge in manufacturing sector productivity in the years following the global financial crisis.
According to the GDP and LEED figures, this surge in productivity primarily occurred in the same sectors that have shed jobs over the past decade – with labour productivity in the textiles industry up 35% between 2007 and 2013, a 12% productivity increase in the wood and paper industry, and a 6.6% rise in productivity for furniture and other manufacturing. The largest increase was in petroleum and rubber manufacturing, up 40%. However, it is likely this surge was largely due to the ramping up of activity in the Tui and Maui oilfields.
The exposure of these industries to foreign competition, and the increasingly capital-intensive nature of manufacturing, is consistent with the increase in manufacturing sector labour productivity. However, it also limits the potential for future job increases in this sector – as overseas producers, with greater scale and easier access to market, continue to undercut domestic manufacturers.
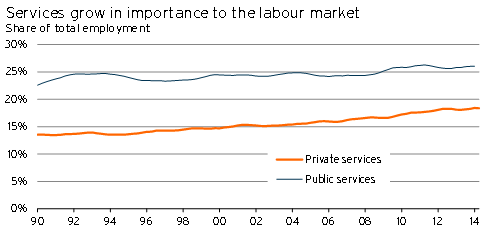
Over the past 25 years, service sector employment has become significantly more important for the New Zealand labour market. According to the QES, the share of total employment in private and public service sectors (excluding recreation and retail services) rose from 38.4% in the March 1993 year to 44.5% in the March 2014 year.
Our regional data relying on LEED estimates suggests a significant increase in the share of service sector employment during the last decade, rising from 41.1% in the 2000 calendar year to a peak of 45.6% in the March 2014 year.
According to QES figures, both private and public service employment has risen in recent years, with private service employment rising from 16.2% to 18.4% between June 2007 and June 2014 while public service employment rose from 24.2% to 26.0% during this period.
However, over the long term, it is primarily private sector service employment that has been the driver behind the increasing share of employment in services. In the June 1994 year, when the New Zealand labour market had recovered from the hard economic slowdown of the late 1980s and early 1990s, public service-related employment was 24.6% of the labour market, while private service-related employment was 13.5%. As a result, even though public service-related employment was the same fraction of the labour market in 2007 as it was in 1994, private service employment was nearly three percentage points higher!
Graph 5.15
The productivity performance in the service sector has come in for special focus by New Zealand’s Productivity Commission. And in one sense this focus seems deserved, given the relatively poor labour productivity performance of the two sectors, especially in recent years.
Graph 5.16
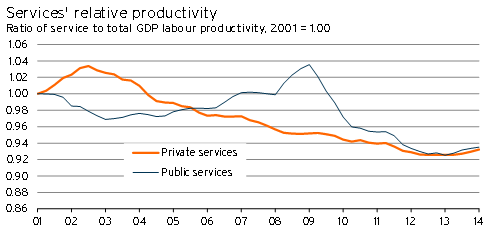
According to the labour productivity figures released by Statistics NZ, labour productivity between 1996 and 2012 declined in the education and administration and support sectors. Public administration is not measured, while productivity growth in health and professional services was below the national average. Conversely, finance and insurance as well as real estate services experienced strong labour productivity growth during this period. This growth was due in large part to economies of scale in these sectors and the utilisation of new technology (such as information and communication technologies) to a greater degree than in other service sectors.
The Productivity Commission’s view of the service sector in New Zealand is that it:
- lacks scale due to New Zealand’s distance from overseas markets and low population density.
- lacks competition and, as a result, there is a large tail of “poorly performing” firms that could easily up their game.
- lacks sufficient investment in ICT.
Although nothing can be done about the first issue, the Commission believes there can be improvements made in the final two areas (as we discuss in The ICT revolution and New Zealand – p61).
We are less cynical than the Productivity Commission about the performance of the services industries in New Zealand. Fundamentally, increasing globalisation, a long-term increase in New Zealand’s terms of trade (based on primary exports), and increasing wealth as a nation will tend to reduce productivity in services industries – especially those that cannot easily “scale up” services.
In this way, relative productivity in service industries is a natural consequence of New Zealand firms taking advantage of globalisation and creating wealth overseas. It is one of the ways that this additional wealth is redistributed across the rest of the economy, as the new income for exporters is used to bid up the price of domestic non-tradable services.
As a result, we expect the trend of rising private service jobs, with relatively lower service sector productivity, to persist over the long term.
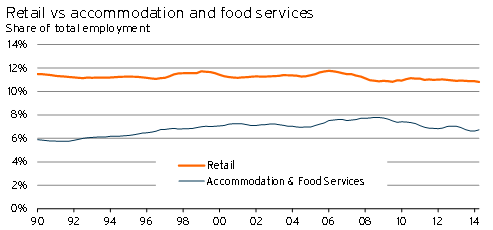
In the 15 years leading up to the Global Financial Crisis and subsequent recession, there was an uneven run-up in the proportion of the New Zealand labour market that worked in the retail, accommodation, and food service industries. With relative retail employment staying relatively stable, this lift was primarily about rising employment in accommodation and food service industries.
Graph 5.17
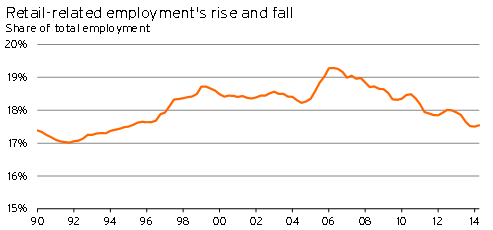
However, the share of total employment made up by this broad sector has been in firm decline in recent years. At the low point in March 2014, this sector’s share of total employment had fallen to its lowest level since March 1995. Although accommodation and food service employment was the main driver of this decline, retail’s share of total employment was only 10.8% by June 2014 – its lowest level on record (going back to 1990).
Graph 5.18
These two trends fit the general narrative of the New Zealand economy, namely that an increasingly wealthy economy will see more spending on (and employment in) non-tradable services, but that globalisation and automation will undermine employment in areas that are exposed to competition from imports.
In this case, accommodation and food service industries serve both domestic consumers and act as an “export” market, while the retail industry competes with imported retail products from overseas. As a result, rising tourist numbers and improving consumer sentiment are likely to drive up the share of employment in accommodation and food services in coming years, but the lower share for retail employment may be here to stay.
One area where there is uncertainty is whether part of the reduction in retail employment is due to increasing substitution “away” from labour towards capital (eg, self-checkouts at supermarkets). In order to consider this question, we need to look at labour productivity.
There have been massively divergent trends in the productivity of the broad retail sector as compared to the productivity of the accommodation and food services sector.
This relative divergence makes a lot of sense when we consider the conditions that the retail sector has faced.
- There has been an increasing concentration of firms in the retail sector, with store types such as The Warehouse and large-scale supermarkets replacing local retailers. The greater scale has made retailing relatively more capital intensive.
- Parallel importing has allowed for significant increases in productivity in the industry.
- The introduction of online shopping has opened up retailing to a global market, increasing the competition faced by retail firms – a factor that forces companies to boost productivity or go out of business.
Graph 5.19
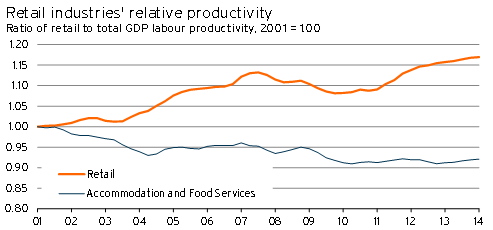
The retail sector is still grappling with the full brunt of globalisation, while technology such as self-checkouts provides another mechanism with which capital investment in scale will continue to increase in the industry. As a result, retail labour productivity looks set to climb further, but the outlook for significant growth in retail employment now appears dim.
While these factors were boosting productivity in the retail sector, accommodation and food services faced increasing demand – both from foreign tourists and New Zealanders with rising disposable incomes – without the ability to significantly improve scale. These types of “non-tradable” industries are notorious for becoming relatively less productive as countries become wealthier, leading to the combination of rising employment shares and lower relative productivity in the accommodation and food services space.
New Zealand has experienced a drastic realignment in the types of firms and jobs that are available. Although the Global Financial Crisis and the corresponding recession helped to accelerate some of these changes, the movements we’ve seen are likely to persist for some time.
The key shifts we have seen are:
- a significant drop in the importance of the manufacturing sector as a source of employment.
- a sharp lift in the importance of construction and service sector employment.
- a recent decline in employment in the usually stable retail industry.
Considering the trends in labour productivity and the changes we’ve seen in the New Zealand and global economies, we have reached the following conclusions.
- Manufacturing employment shares are likely to stabilise, but given the intensity of competition from overseas, we do not expect manufacturing industries to become more important in New Zealand. In the longer term, there is scope for manufacturing employment shares to decline even further.
- Construction employment shares are likely to stay elevated, as demand from the Canterbury rebuild and a surge of activity in Auckland persist over the coming years.
- Service sector employment is likely to continue to rise as a share of total employment, as the flipside of globalisation and increasing automation in the manufacturing sector. There is a risk that rising service automation could undermine this outlook – an issue discussed in The ICT revolution and New Zealand.
- The decline in the share of employment that is taking place in the retail sector is expected to persist, as increasing concentration of firms and competition from online shopping make the industry more capital intensive.
Overall, New Zealand appears to be moving in a similar direction to other Western nations – with employment prospects strongly tied to the service sector.