Where house sales go, prices don’t necessarily follow
Where house sales go, prices don’t necessarily follow
Back in January 2004, Infometrics put outa press release concluding that "property values will begin to fall before the end of this year: some areas that have experienced large price increases (such as Nelson) could undergo a nasty correction." After four years of resolutely predicting an impending slowdown in the housing market, it seems we’ve finally got it right!
Now everyone else has jumped on the wagon of gloom, but we’re not sure it’s as bad as the headlines suggest. At the moment, the biggest challenge for the doomsayers is trying to find the thousands of investors and homeowners that are being forced to sell. Admittedly, there have been incidents of significant losses incurred by apartment owners, but New Zealand’s apartment market remains incredibly immature by international standards and has provided ample scope for buyer naivety to be exploited. And there has been a lift in the number of properties being touted as "mortgagee sales", but that may simply be a convenient way to attract buyers who are looking for a bargain.
House sales figures for March were plain horrible. The Real Estate Institute reported that sales numbers were down 53% on March 2007. To put this fall in context, the previous biggest drop since data began in 1989 was a 38% fall in April 1998. With turnover plunging so rapidly, it’s small wonder that real estate agents are rushing off to find new jobs.
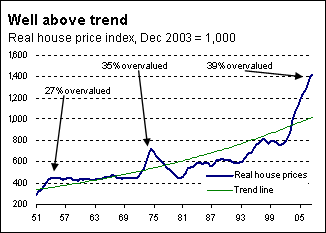
Other commentators have been quick to latch on to the trend in house sales activity and talk up the extent of the likely price falls over the next 1-2 years. For example, BNZ, who are currently the biggest cheerleaders for an economic recession, state that "house prices risk falling by more than the 10% we already presume for this year." BNZ estimates that house prices are currently 30% overvalued – a number that our estimates suggest may be on the light side.

Looking back over the last 60 years, there have been two previous episodes where property has become significantly overvalued. After a 66% increase in real house prices (adjusted for consumer price inflation) between 1950 and 1954, real property values tracked sideways for the next 18 years, with no discernible increase occurring until the early 1970s.
Then real house prices jumped a whopping 59% between 1971 and 1974. Over the next six years, those gains were completely wiped out as real property values plunged. House prices still averaged 6.1%pa growth between 1974 and 1980, but failed to keep pace with rampant consumer price inflation of 15%pa.
Which outcome is most likely for the housing market? Right now, the New Zealand economy looks a lot more like a 1950s version than the 1970s one. Unemployment is low, prices for our exports are strong, and inflation is more or less under control.
That’s not to say a soft landing is a risk-free proposition. Soaring oil and food prices are having a significant negative effect on consumer confidence. Trading banks are finding it tougher to obtain funding as a result of America’s credit crunch. And there is a chance that the government’s push to create "affordable housing" results in too many new houses being built, as occurred in the mid-1970s.
Infometrics’ view is that the massive drop in house sales activity in recent months reveals a firm dichotomy between the prices that vendors want for their property, and what buyers are willing or able to pay. The fact that property is not changing hands implies that no one is being forced to sell – yet. Two factors suggest that situation is unlikely to change much over the coming year.
Firstly, demand for rental accommodation remains strong given that first-home buyers have been priced out of the market for the last 3-4 years. With property investors no longer increasing their holdings, the supply of rental property is relatively static, allowing landlords to push up rents (currently by around 7%pa) without significant risks of vacancy. So as a landlord, your ability to keep servicing the mortgage looks good.
Secondly, low unemployment and the tight labour market indicate good job security and continued income growth. As a homeowner, your ability to keep servicing the mortgage also looks good.
Neither of those points is to deny the inevitable fact that some people will have overextended themselves – most likely highly or negatively geared property investors. But our table shows that even someone stretching themselves to buy an average house in 2004 should have more money left over after paying the mortgage than they did two or four years ago. Admittedly, recent price rises for essentials will be stretching household budgets, but there are mechanisms to temporarily ease the pressure. In this example, an interest-only mortgage would free up around $300 per month.


