From the beach 2016
Heading into 2016, the Chinese economy is dominating our thinking as we try and work out how much more of a slowdown will occur this year. Less buoyant growth in China potentially has flow-on effects for monetary conditions both here and overseas, and may also influence the rate at which international dairy prices improve this year. And while the Reserve Bank may look like its latest loan-to-value restrictions have helped it get on top of the Auckland housing market, we are sceptical about how long that feeling of control will last.
With little other news to talk about during the holiday period, China’s volatile stock market has frequently featured in the headlines recently. The Shanghai market shut early twice in the first week of trading this year, having reached the trigger point for closing of a 7% decline for the day. At the time of writing, though, the market was still at a comparable level to where it was in October and up about 50% from its mid-2014 level.
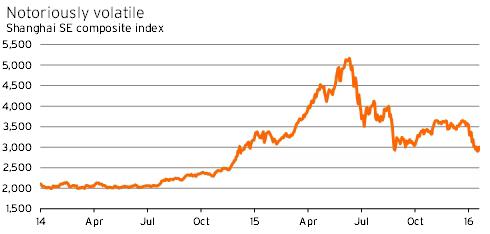
We have previously argued that movements in China’s stock market bear little resemblance to economic outcomes. This bifurcation could be due to the fact that China’s market is relatively small and immature compared to the country’s overall economy, as well as being subject to government interference from time to time. But with total GDP growth over the last 15 years running well in excess of how far the stock market has risen, the divergence could equally be a reflection of how (in)accurate the official Chinese GDP numbers are.
The Chinese government’s goal of doubling GDP between 2010 and 2020 requires its economy to grow by about 6.5%pa over the next five years. This rate of growth is below the 7.0% target that was set for 2015, and talk of an implicit 6.5%pa target seems to be an admission by Chinese officials that the economy is struggling.
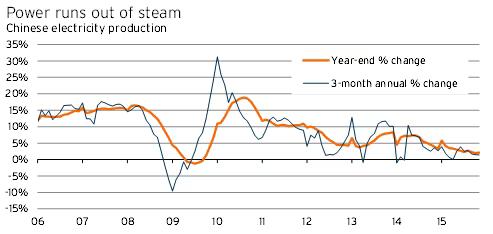
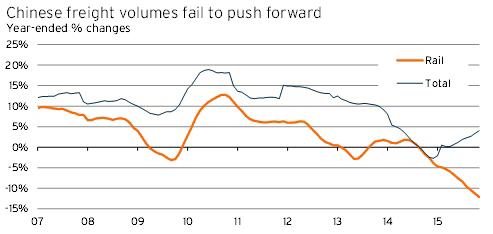
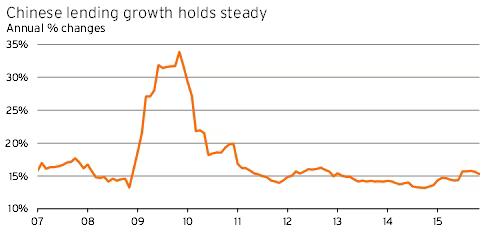
So we’re all fairly certain that Chinese growth is slowing, but to what degree? Electricity production in China in the year to November 2015 grew by just 2.1% – slightly up from October’s growth rate, which was the smallest annual lift since late 2009 in the aftermath of the Global Financial Crisis. Rail freight volumes have plunged 12% over the last year – the biggest decline in at least a decade. Total freight volumes, which are dominated by road transport, are less downbeat, having risen 4.0% over the 12 months to November, although that growth rate is still slower than at any time between 2006 and April 2014. Bank lending is the only indicator not to be raising concerns at this stage, with growth holding at 15%pa, close to the average of the last five years.
Should New Zealand businesses really care about weaker growth in Chinese production? After all, our exports to China are dominated by food commodities rather than minerals and metals, and there still seems to be growth in demand for food. Even the dairy sector, which has been hit hard by increased supply out of Europe and large stockpiles in China, has started recovering – the value of dairy exports from New Zealand to China in October and November was up 28% from a year earlier.
The real key for New Zealand is the potential flow-on effects from a major Chinese slowdown into other Asia-Pacific economies. Consensus forecasts for Southeast Asian growth in 2016 have slipped from 5.1% to 4.4% since January last year, and Australia’s prospects have also dipped from 3.1% to 2.6%pa growth. Furthermore, if China’s growth is slowing by more than the official GDP numbers would indicate, we could see further downward revisions to growth prospects for the other Asian economies in coming months. Keep an eye on the partial indicators coming out of China.
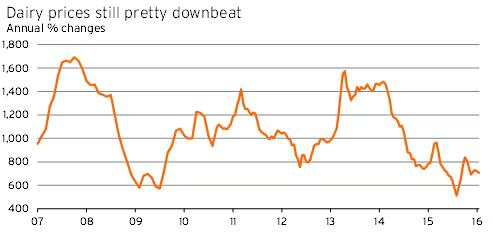
International dairy prices at the first two GlobalDairyTrade auctions of the year slipped 3.0% to be back below where they were at the start of December. Prices are still down 11% from a year earlier, although they have recovered 38% from their low point in August 2015.
Estimates from the US Department of Agriculture show that China’s stockpile of whole milk powder (WMP) increased from 130,000 tonnes to 300,000 tonnes between the start of 2014 and the beginning of 2015. By way of comparison, Chinese imports of WMP in 2014 were 671,000 tonnes, and an estimated 350,000 tonnes in 2015.
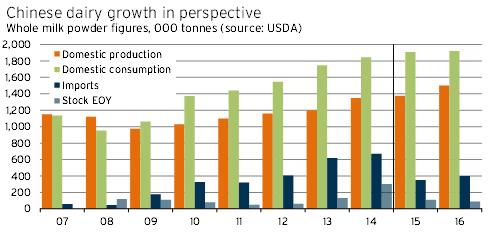
The USDA attributed the increased stockpile to expectations of high prices during 2014 leading to early (and excessive) purchasing, as well as a new government policy around imports that encouraged purchasing ahead of the change in May 2014.
By January 2016, the USDA estimates that WMP stocks in China will have fallen back to 109,000 tonnes. However, imports this year are only expected to total 400,000 tonnes, which would be lower than in each of the 2012-2014 calendar years, with growth constrained by increased domestic production of WMP. Low dairy prices are encouraging Chinese producers to turn more milk into WMP and store it to try and avoid near-term losses. Overseas investment and active diversification of supply sources by Chinese firms indicate that New Zealand’s 90% market share of WMP imports into China will also continue to be eroded.
US dairy production between January and October 2015 was up 1.3% from a year earlier, and European production rose 1.8% over the same period. With sluggish demand growth in China and continued increased in international supply, the road to recovery for dairy farmers looks likely to be a slow one. At this stage, a payout of about $5/kgms this season looks likely to be followed up by a $5.50/kgms payout in 2016/17. Only in the 2017/18 season are dairy prices likely to push back above $6/kgms.
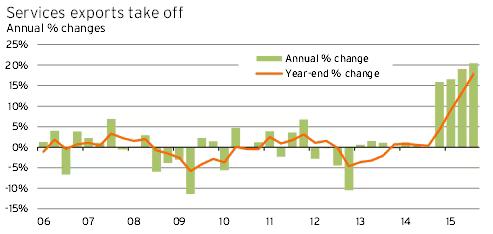
However, it’s worth re-emphasising that dairy is not the only game in New Zealand’s economic town. Services export volumes in the year to September 2015 expanded at a 16-year high of 18%pa. This growth included a 37% lift in the value of holiday travel to NZ, a 16% rise in foreign education travel, a 47% rise in business travel, and a 19% rise in IT service exports.
It’s certainly a stretch to say that monetary conditions internationally will return to “normal” this year, but central banks in the US and the UK are starting to move interest rates in that direction. The Federal Reserve has been quietly tightening monetary conditions for a couple of years, scaling back and then ending its quantitative easing programme, before lifting the Fed funds rate at the end of 2015. This year is likely to see at least two more rate rises by the Fed, while the Bank of England is also expected to lift interest rates for the first time since 2007.
In contrast, New Zealand’s official cash rate is at a record low of 2.5% and any tightening in monetary conditions here is a long way off. If anything, the risks around the OCR still lie to the downside, with moderate economic growth and persistently low inflation maintaining pressure on the Reserve Bank to maintain stimulatory monetary conditions. Even without further interest rate cuts, the gap between domestic and offshore short-term rates is set to shrink to its smallest since 1999 – an outcome that must place downward pressure on the New Zealand dollar.
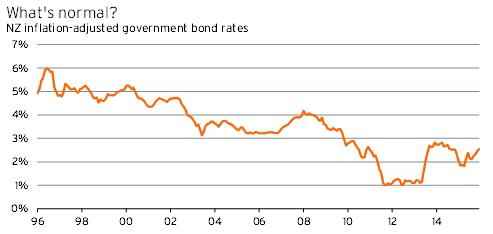
The big unknown, both here and internationally, is what level of interest rates should be considered “normal” going forward. Long-term real bond rates in New Zealand were at 2.5% in December – only just below the average of the last ten years (2.6%), but well below the 1998-2007 average of 4.1%. We’d suggest that, over the medium-term, real interest rates should settle somewhere between these two averages. The 1998-2007 average reflects unsustainably high economic growth and investment returns, while the 2006-2015 period is coloured by the flight to safety in the wake of the Global Financial Crisis.
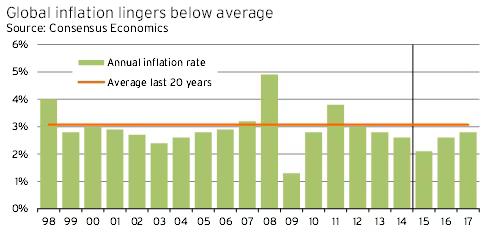
The other component of predicting interest rates is inflation. Consensus forecasts show that global inflation is expected to rebound from 2.1% in 2015 to 2.6%pa this year. Although the latter inflation rate is roughly in line with the 2013 and 2014 results, it remains below historic averages and implies that modest global economic growth will still leave spare productive capacity internationally. And with oil prices plunging to 12-year lows of US$30/bl, there is every chance that inflation, both here and overseas, will turn out to be weaker than is currently forecast.
In New Zealand, in particular, firms must bear in mind that the current slowdown in economic growth will only make it harder for them to pass on any cost increases they are facing (eg from the lower exchange rate).
The housing market is perhaps an even hotter topic this summer than it was at the start of 2015. A year ago we were seeing signs emerging that the shortage of housing in Auckland was reasserting its influence and pushing up house prices more quickly. The question now is whether the Reserve Bank’s latest loan-to-value restrictions will take the heat out of the Auckland market for a sustained period, or whether a lot more new residential building is required before the previous undersupply is no longer an issue.
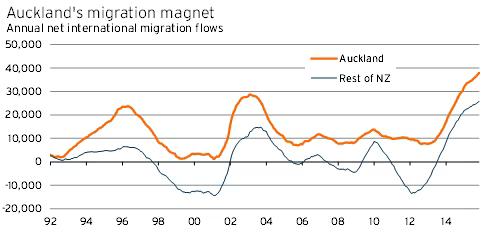
Perhaps the clearest response to that question is given by migration flows. Net migration has surged to a record level of 63,659 in the 12 months to November 2015, pushing population growth up to a 40-year high. And of that net inflow, figures from Statistics NZ show that Auckland’s share is almost 60%. A simple assumption of three people per household implies an additional 12,600 dwellings were required in Auckland for net migration alone over the last year. With consent numbers in Auckland in the year to November totalling 8,934, it seems inconceivable that the Reserve Bank’s LVR measures, even in tandem with the new bright-line test for capital gains, will be able to quell Auckland’s housing market for very long.
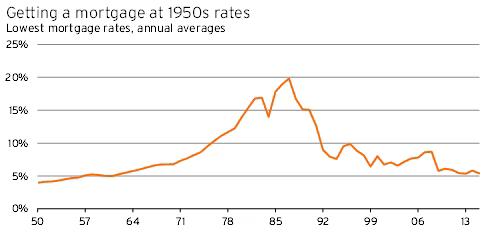
Remember, too, that mortgage rates are currently at their lowest levels since the late 1950s or early 1960s. Financing costs may be a secondary consideration for purchasers in Auckland given how stretched income-to-loan ratios in the region have become, but around the rest of the country, very low mortgage rates will help support the market. Strengthening demand for housing has been particularly evident in the regions around Auckland, and we expect further upward pressure on house prices as mortgage rates stay low throughout 2016.