Keeping tabs on Christchurch’s population
Much has been made of the likelihood that Christchurch will suffer a significant hit to its population in the aftermath of the earthquake in February. Good information on population movements within New Zealand is almost non-existent, but Statistics NZ is currently monitoring re-enrolments of school students from Christchurch and surrounding areas following the quake. This article examines the initial trends, although it is too early to try and draw conclusions about the implications for population growth in Christchurch.
As at 16 March, 8,166 students from the quake zone 1 had re-enrolled at other schools around the country following the disaster in February. This represented approximately 10.7% of student numbers from the area. 2.
Of the 8,166 students that had re-enrolled in other schools, 654, or 8% of students had since returned to their original school. However, that leaves 9.9% of students from the quake zone that were still not back at their original school. A significant proportion of these students had been re-enrolled at correspondence school or other schools within the quake area, which leaves 8.3% of the quake area’s school-age population that has moved toothier areas around the country.
Graph 1 shows the ten areas that have experienced the biggest absolute number of re-enrolments of students that had previously been enrolled at schools within the quake zone. The graph shows that, with the exception of Auckland, the relocation of students has been most prevalent to other areas around the South Island 3.
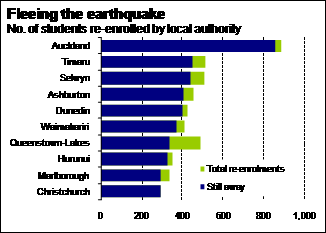
Graph 1
Graph 2 shows the ten areas where the percentage increase in student numbers has placed the biggest stress on resources in the education system. The pressure has been most keenly felt in provincial South Island areas, where a reasonably modest lift in absolute student numbers represents a big percentage increase in the number of students. The North Island area with the biggest percentage lift in student numbers (Carterton) doesn’t appear until24th on the list.
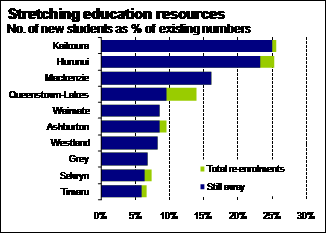
Graph 2
With 8% of students having already returned to their original school within the quake zone, it is clear that some of the initial reaction of people to leave Christchurch after the quake is only temporary as we would have expected. Graph 3 shows those areas that have recorded the largest reversal in re-enrolments. Queenstown-Lakes has a much higher figure than all other areas, and reflects anecdotal evidence of a significant influx of people into Wanaka and Queenstown following the quake. Importantly, however, there appears to be no discernible pattern among the other areas that have seen student numbers drop away again. There is a mix of urban and provincial areas, as well as a mix of North and South Island areas.
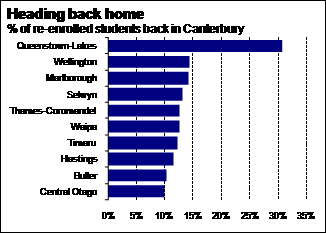
Graph 3
We recognise that there are two important factors which mean that movements in school-age people are not necessarily an accurate indicator of permanent shifts in the overall population.
- The magnitude of the shift out of the quake area is likely to be overstated by the student movements. Many parents will have reacted to the quake by sending their children away to stay with extended family while they feel insecure about possible aftershocks and while they deal with the required clean-up.
- Current choices for relocation will be influenced by a number of factors, including the location of extended family, holiday houses, and proximity to Christchurch. Over the longer-term, the main determinant of where families will choose to live is employment. On that basis, we would expect the permanent population movement to areas such as Kaikoura and Hurunui, where employment opportunities are likely to be limited, to be less pronounced than to larger urban centres.
We will continue to monitor this data over coming weeks to try and gain a better picture of how much of the initial outflow of students is reversed. Over time, we should also get a clearer picture of which areas are showing a more permanent population gain from Canterbury following the quake.
We will also monitor international migration data as it becomes available to gauge the extent of any change in overseas population flows in and out of the Canterbury region following the quake.
1Christchurch City, Selwyn District, and Waimakariri District.
2As a percentage of enrolments in July 2010, the most recent base data available.
3 Readers will note the inclusion of Selwyn, Waimakariri, and Christchurch on the graph. The presence of Christchurch suggests that there has been substantial churn of students even within even within the city. Although the re-enrolment numbers in Selwyn and Waimakariri may also be partly a result of churn within these areas, they are also likely to include a significant number of students that were previously enrolled at schools in Christchurch.