What is economic diversity and why does it matter?
The economic challenges brought about by the global pandemic, the war in Ukraine, adverse weather events, and the cost-of-living crisis mean that our regional economies are being rocked by economic forces that are both unprecedented and largely out of our control. Different events can affect different parts of a local economy in different ways. Economic diversity can help weather these storms. If some sectors are struggling, other sectors have the capacity to maintain economic momentum. A lack of economic diversification can increase an economy’s vulnerability to external shocks, which can cause volatility in economic growth and undermine prospects for longer-term economic growth.
Understanding economic diversity in an economy is about analysing the diversity of ways that an economy creates economic output. A common way to do this is to look at the relative size of the industries that make up an economy. Here, we outline a framework for doing so.
How is economic diversity measured?
The Herfindahl–Hirschman index (HH Index) is a common way to measure economic diversity, to measure how diversity has changed over time, and to compare economic diversity across different economies. The HH Index is calculated by squaring each industry’s share of Gross Domestic Product (GDP) then summing the resulting numbers.
Table 1 shows a very simplified example of how the HH Index is calculated for two hypothetical economies, one more diversified than the other. In the more diversified economy, GDP is spread fairly evenly with approximately a third in each of the three broad industries. In the less diversified economy, two thirds of GDP is concentrated in primary industries alone. The less diversified economy has higher HH Index: 4,418 compared with 3,366.
The hypothetical example has the HH Index calculated across three broad sectors. In reality, the HH Index is usually calculated at a much finer level of industry disaggregation.
More diversity means less volatility
Chart 1 shows the HH Index calculated for two Territorial Authorities: Tauranga City and Waimate District. These two were chosen because Tauranga City has one of the most highly diversified local economies in New Zealand and Waimate District has one of the least diversified. In 2022, Tauranga City had a HH Index score of 320, which was much lower than Waimate District’s HH Index score of 1295.
In Tauranga City, the largest industries (construction, professional, scientific, and technical services, and healthcare and social assistance) each made up 9% of total GDP in 2022. In contrast, in Waimate District, the dairy cattle industry made up 27% of total GDP in 2022 and sheep, beef cattle and grain farming 12%.
Waimate District’s economy has become less diverse over time as shown by the HH Index increasing from a low of 897 in 2008 to 1295 in 2022 in Chart 1. This trend was caused largely by an increase in the size of the local dairy product processing industry from 0.5% of total GDP in 2008 to 7.4% in 2022.
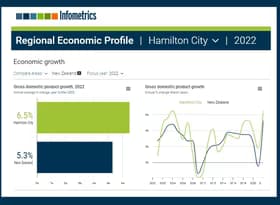
You can see the implications of this greater diversity in Chart 2 which shows annual percentage change in economic output over time for Tauranga City and Waimate District. Tauranga City’s economic growth has tended to be much less volatile. At any given time, some industries will be performing better than others. In a diversified economy, these differences will cancel each other out to a degree.
Waimate District’s dependence on dairy farming means it is strongly influenced by dairy farm profitability, which tends to vary year-to-year depending on the price of dairy products on international markets and the price of dairy farm inputs. When dairy farming is less profitable this weakens economic growth across the whole economy because other local industries are not big enough to bolster economic growth. In fact, if dairy farms are less profitable this can have compounding, flow-on effects on the rest of the economy as farmers may cut back on production leading to a reduction in processing, invest less in machinery, cut staffing numbers, or spend less at local businesses such as retail and hospitality.
Diversity is difficult to achieve
This analysis isn’t intended to be critical of Waimate District’s lack of economic diversity. I have had many conversations with regional economic development practitioners over the years who have all said how challenging it is to increase diversity in a local economy. Aside from industries such as education, healthcare, construction and retail, which serve the local population, local economies tend to gravitate towards what they do best. So, if there is a prevalence of land that is good for dairy farming in your local area, you are probably going to have a large dairy industry.
And a lack of diversity can become self-perpetuating to a degree. For example, upstream or downstream industries develop to serve the dominant industry (such as dairy equipment manufacturing and sales, and dairy processing in the case of the dairy industry), and your local workforce becomes skilled at dairy farming and passes those skills on to younger generations.
But as a first step to making changes to increase diversity, it is important to know how diverse your local economy is and, if it isn’t diverse, why it isn’t.
How can I monitor economic diversity in my local economy?
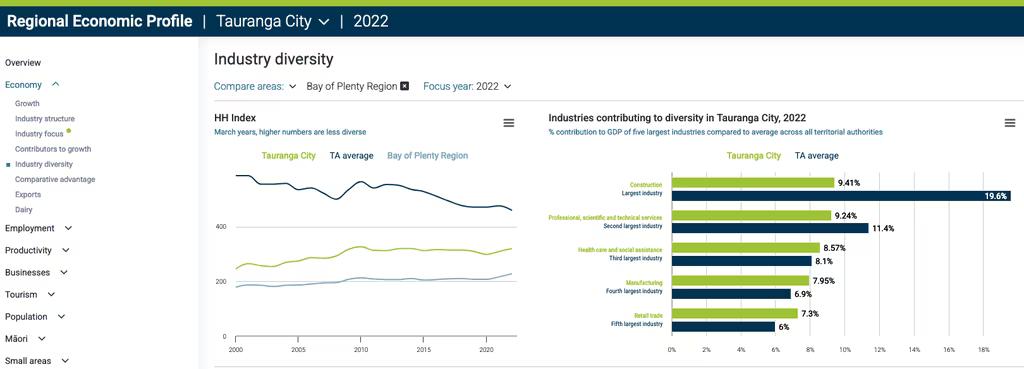
Our refreshed Regional Economic Profile interactive data dashboard enables you to monitor diversity in your local economy. Select your area of interest at the top of the screen, then in the navigation menu on the left-hand side of the screen click on Economy, then Industry diversity (see Figure 1). On this page you will see your local area’s HH Index score and how it has changed over time, as well as the industries that contribute most economic diversity in your local economy.
Figure 1: Screenshot of the HH Index industry diversity dashboard in the Regional Economic Profile
If you need assistance interpreting the industry diversity information in the Regional Economic Profile, or if you want to discuss economic diversity more broadly, please contact one of our economists.