Auckland’s growth dominance continues, for now
Infometrics’ new estimates of regional GDP show that Auckland was the fastest growing region in the year to March 2018, expanding by 3.9% (see Graph 1). Auckland has regularly been towards the top of the regional league table throughout the last seven years. Its growth during 2018 was underpinned by a strong services performance, with industries such as professional, scientific, and technical services, financial and insurance services, and retail trade all expanding by more than 5.0%.
Graph 1
South Island stars in 2018
Looking at a city and district council level, the three fastest growing areas were Kaikōura, Queenstown-Lakes, and Waimate (see Graph 2).
Graph 2
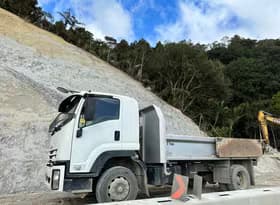
The 7.2% expansion in Kaikōura’s economy was the area’s fastest growth since 2004. Unsurprisingly, this growth was driven by construction and road transport as repair and rebuilding work got into full swing following the November 2016 earthquake.
Although the Queenstown-Lakes economy expanded 6.4% during the year, this result still represented the district’s slowest growth in five years. The slowdown partly reflects the area’s population growth, which has eased from 7.1% to 5.7%pa since mid-2016. Even so, Queenstown-Lakes’ population growth is still the fastest in the country and shows through with broad-based growth across most industries in the district. The strength of the district’s tourism sector is also evident, with accommodation and retail trade among the biggest contributors to growth.
Waimate’s economic activity expanded 6.3% during 2018. An increase in dairy product manufacturing contributed almost half this growth, with a $400m investment at Oceania Dairy’s factory in Glenavy significantly expanding production in 2017/18.
Few areas shrank thanks to broad-based growth
Only two districts shrank in 2018 – the smallest number on record (stretching back to 2001). Buller continued to struggle, as mining and manufacturing activity in the district declined. The Buller economy has now contracted for six consecutive years.
In the Southland District, pressure on the agricultural industry and reduced heavy and civil construction activity led to a 0.2% decline in GDP.
The other main centres
We note several other key points from our latest GDP estimates.
- The Wellington Region recorded its slowest growth in five years (2.7%). Regional growth was held back by poor performances for arts and recreation services, information media and telecommunications, wholesale trade, and education and training.
- Canterbury’s growth stabilised in 2018 (2.9%pa), following a sluggish performance in 2016/17 as quake rebuilding activity in Christchurch wound down.
Graph 3 shows the biggest contributors to nationwide economic growth during the March 2018 year (excluding Queenstown-Lakes and Selwyn, which were shown in Graph 2).
Graph 3
Looking towards the provinces for 2019
Regular readers of our material will recall our forecast in mid-2018 that provincial areas were likely to dominate New Zealand’s growth prospects over the next 18 months. At first glance, the dominance of Auckland in this data conflicts with that outlook. However, economic growth has become more difficult to achieve in Auckland throughout the last year due to slowing population growth, the softening housing market, a shortage of workers, and capacity constraints in key industries such as construction. We expect that the widespread nature of growth shown in the 2018 data will swing more towards provincial areas when data for 2019 becomes available.


