Chart of the month: New Small Area Boundaries
Small area boundaries have changed in New Zealand and Infometrics is gearing up for the changeover. We are evolving our Small Area Economic Profiles (https://www.infometrics.co.nz/product/small-area-profiles) into a more comprehensive Small Area Economic Framework based on the new boundaries. The new Framework will enable clients to see how economic activity, employment and population is spread across their district. It will be available to clients at the end of February, following the release of the 2018 Regional Economic Profiles at the end of January next year.
The new framework will be built using small areas known as Statistical Areas 2 (SA2) which replace the old Area Units (AU). The SA2 geography aims to reflect communities that interact together socially and economically. SA2s in city council areas generally have a population of 2,000–4,000 residents while SA2s in district council areas generally have a population of 1,000–3,000 residents.
Many Infometrics clients are familiar with the existing AU boundaries. To help understand how the AU boundaries relate to the new SA2 boundaries we have constructed a Sankey diagram for each territorial authority in New Zealand.
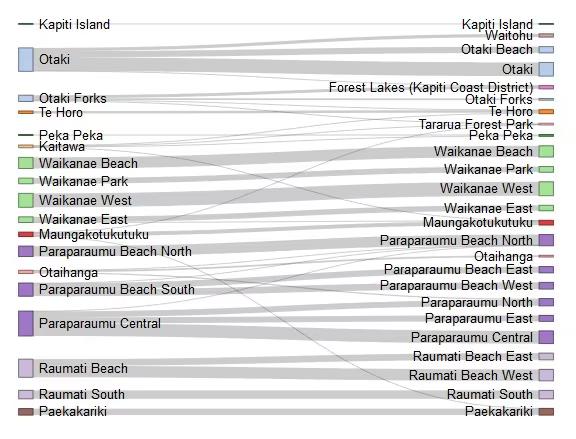
The Sankey diagram below shows the relationship between the 18 old AUs in Kāpiti Coast District and the 25 new SA2s. Some urban areas are completely or nearly identical, such as Waikanae and Paekakariki. Some urban area units, such as Otaki and Raumati Beach, have been split in to two or three SA2s, providing further detail. The rural area was mostly split over three area units (Otaki Forks, Kaitawa and Maungakotukutuku) but these have been split over a larger number of SA2s with quite different boundaries.
If you would like to know how the SA2s in your area relate to the old AUs please contact Andrew Whiteford at andreww@infometrics.co.nz
How do the old area units (LHS) relate to the new Statistical Areas 2 (RHS) in Kāpiti district?