The demand crisis facing tourism
Soaring international visitor arrival numbers have thrown the spotlight on New Zealand’s tourism sector, with concerns expressed about whether we have the infrastructure to cope with the massive lift in arrivals that has occurred over the last three years. John Key has pledged $12m to provide better facilities, such as public toilets, to areas with small populations but a big tourism presence. The government has also established “Project Palace” to try and attract investment for the construction of new hotels, with the availability of accommodation becoming a significant constraint in many parts of the country.
We have constructed estimates of demand for commercial accommodation units and compare them with the supply of units in Graph 1. These estimates of demand do not make any adjustments for increases in the use of peer-to-peer accommodation, a topic we examined in a recent article. Although there has been significant growth in Airbnb, in particular, that growth has been nowhere near enough to make up for all of the increased demand for accommodation by visitors to New Zealand over the last couple of summers.
Graph 1
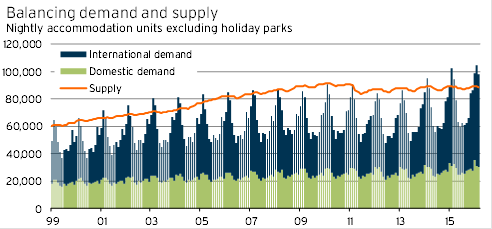
Our estimates confirm that, at peak times, the commercial accommodation sector is under the most capacity pressure in the last 20 years. For 2015 and 2016, all three months at the start of the year had demand estimates above supply.
The seasonal swings in domestic demand for accommodation are relatively minor compared with the international movements. The big seasonal component in domestic holidaymaking is taken up by holiday parks, rather than other commercial accommodation types.
The phases when peak demand is most running ahead of supply generally coincide with those periods when accommodation costs are increasing at their fastest. Graph 2 compares growth in accommodation costs (over and above general CPI inflation) against our estimates of under or overcapacity in the commercial accommodation stock (positive figures indicate a shortage of accommodation). It is unsurprising to see the fastest increases in accommodation costs occurring in 2003 and 2016.
Graph 2
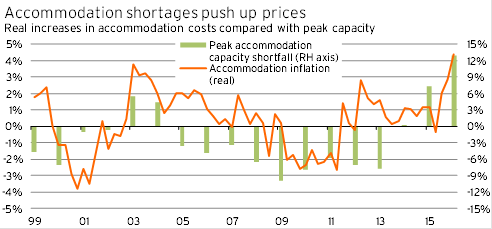
It is also worth remembering that the figures in Graph 1 are based on monthly data and are nationwide, so the pressures will be more exacerbated in certain areas (eg Queenstown, Auckland, and Dunedin) and at key times within certain months such as January and February.
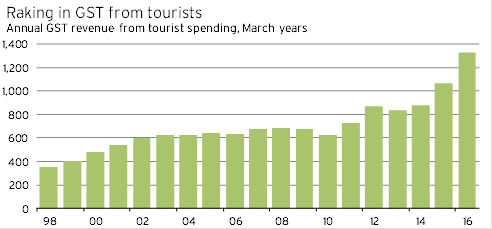
Graph 3 shows the GST revenue received by the government from tourist spending over the last 20 years. The amount has more than doubled since 2010, and rose by 25%, or $268m, in the March 2016 year alone. These figures highlight how pitiful John Key’s pledge of $12m (spread over four years) is to help boost tourism infrastructure in small communities.
Graph 3
If New Zealand wants to maintain the increases in tourist activity that we’ve achieved over the last few years, and potentially generate further growth, the government needs to be serious about treating tourism as a major industry and playing an active role in ensuring that visitors have an enjoyable and high-quality experience while they are here. Otherwise, the industry risks treating foreign visitors like a cash cow, running into reputational problems, and suffering the same downturn in demand that afflicted the foreign education sector from about 2003 onwards.
This article is a summarised version of a full article that is available to clients on our website.