Revisiting our view of underlying car demand
Calculations of underlying car demand using replacement demand, car ownership rates, and household formation show that there is fundamental support for total car sales (new and used imports) to average almost 209,500pa over the next five years – in line with our baseline forecast that sales will average 207,700pa.
Our central models for forecasting new and used import car registrations are driven by a variety of factors, including economic and labour market conditions, exchange rates (as these affect car prices), fuel prices, and interest rates. Although these models are useful for gaining an idea of the likely direction and strength of changes in discretionary car demand, we also cross-check the models for sensibility against more fundamental drivers, such as the underlying size of the New Zealand car fleet and turnover within the fleet.
This article updates our view of average annual underlying car demand over the next three years on the basis of three fundamental drivers of car demand.1 These fundamental drivers are replacement demand, the ownership rate, and household formation.
Defining the drivers
Replacement demand is measured by the scrap rate (the rate at which cars are retired from the existing vehicle fleet). The age structure of the fleet influences the scrap rate, as well as the underlying health of the economy. The scrap rate typically rises during good economic times, but households are more likely to hold off scrapping their old car when the economy is going poorly.
Car ownership and household formation rates affect the underlying size of the car fleet. We measure car ownership by the number of cars per household. Car ownership is driven by both the need to have a car to go about day-to-day activities, as well as a more discretionary element that can fluctuate with the economic cycle. Household formation rates are affected by a variety of factors, including conditions in the housing market and population growth.
Quantifying fundamental car demand
Using the fundamental drivers of car demand listed above, we have derived a range of scenarios for annual average car demand over the next five years (see Table 5.1). These scenarios are designed to show what type of assumptions regarding scrap rates and car ownership rates are needed to fundamentally support certain levels of car sales each year. Each scenario makes use of the household formation rate from our economic and building forecasts (8.3%pa over five years to March 2019).
The central scenario suggests that there is fundamental support for car sales to average 209,454pa over the five years to March 2019. This scenario is broadly in line with our baseline forecast that car demand will average 207,700pa over the same period.
The central scenario assumes that the scrap rate averages 7.0% of the fleet each year, which was the level of scrappage that prevailed over the ten years before the Global Financial Crisis hit in mid-2008. With scrap rates having already risen from a low of 4.0% in September 2010 to 6.0% by March 2014, this assumption seems reasonable – particularly when one considers how quickly the labour market is picking up. This scenario conservatively assumes that car ownership remains at its current level of 1.43 cars per household throughout the next five years.
Table 5.1
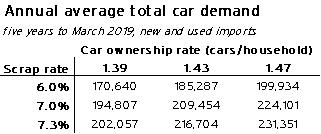
Although the peripheral scenarios do not coincide with our central forecasting view, they provide useful thought experiments as to what could move car sales away from our forecast over the next five years.
The most pessimistic scenario shows car sales averaging 170,640pa over the next five years – about 15% below the current annual running total of car sales. This scenario pessimistically assumes a scrap rate of 6.0% and a car ownership rate of 1.39 cars per household. Even over the last five years of challenging economic conditions, the scrap rate still managed to average 6.0%, while car ownership never fell below 1.40 over the same period. Therefore, with economic indicators suggesting that the New Zealand economy is in the midst of a broad-based improvement, it is unlikely that the scrap and car ownership rates will be so subdued.
The most optimistic scenario shows car sales averaging 231,251pa over the next five years – about 15% above the current annual running total of car sales. This scenario optimistically assumes that the scrap rate averages 7.3% (its average over the five years before the Global Financial Crisis), while the car ownership rate rises to 1.47 cars per household (its peak from late 2007). We believe that both of these scenarios are unrealistic, as the sharp upturn in the car market during the mid-2000s was supported by rampant credit growth, and it appears that household credit growth will be more moderate this economic cycle.
1 For an example of previous articles see www.infometrics.co.nz/Forecasting/10095/901/Fundamentals-support-further-lifts-to-car-demand.
