Slower population growth than we thought
When Statistics NZ announced that New Zealand’s usually resident population at the 2013 census was just 4,242,048, we were rather surprised. The result was almost 222,000 people, or 5.0% short, of the population previously estimated for March 2013. Taken in tandem with new figures on the number of dwellings around the country, the result potentially has some significant implications for occupancy and vacancy rates in different regions. It also raises questions about how big the apparent undersupply of housing in Auckland might actually be.
The 2006 benchmark
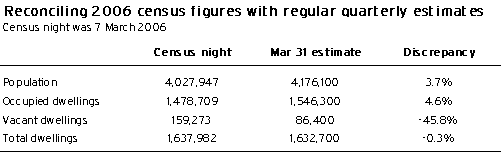
Table 5.1 provides a stocktake of the 2006 population and dwelling numbers at a national level, comparing quarterly estimates of the population and dwelling stock published by Statistics NZ with the census night numbers from that year. Table 5.1 shows that in 2006, there are significant discrepancies between Statistics NZ’s regular estimates and the census night figures, which are due to definitional differences.
- Census night usually resident population excludes New Zealanders overseas on census night. However, the quarterly estimates of the resident population include all people who usually live in New Zealand, and are also adjusted for any undercount that may have occurred at the census. Along with the slight date difference (the population estimates are as at the end of March, with the census taking place in early March), these differences represented over 148,000 people, or 3.7% of the population, at the 2006 census.
- Although the total number of dwellings does not differ greatly between the census night count and the regular estimates, the split between occupied and vacant dwellings is vastly different. As with population figures, the census count of occupied dwellings excludes households where all members are overseas on census night, as well as those households where all members are not in the dwelling (but elsewhere in New Zealand) on census night or in the following 12 hours. Residents being “away” accounted for 49,100, or 31%, of vacant dwellings at the 2006 census, and would be counted as occupied under the regular estimates published by Statistics NZ.
Table 5.1
These definitional differences will also account for some of the gap between the 2013 census night figures and the quarterly estimates that have previously been published. However, some of the gap in the 2013 figures will be a result of wayward estimates of changes in the population or dwelling stock over the last seven years.
Losing track between 2006 and 2013
Statistics NZ’s quarterly population estimates can be wide of the mark due to “category jumpers” in international travel flows. For example, people intending to head overseas for less than 12 months will be counted as a temporary departure and will not be removed from New Zealand’s resident population. However, if the same person returns after more than 12 months overseas they will be seen as having been overseas “long-term” and will be re-added to the country’s resident population.
Similarly, an immigrant coming to New Zealand for more than 12 months (intended) will be counted as a permanent arrival and added to the resident population. However, if that same person then leaves New Zealand after less than 12 months, they will be seen as having been here temporarily and will not be removed again from the resident population.
These discrepancies highlight the difference between people’s intentions when they first cross the border (in or out of the country) and what has actually taken place when they cross the border the second time.
In terms of the overall dwelling stock, Statistics NZ’s estimates can be astray on two counts. Firstly, additions to the dwelling stock are estimated based on dwelling consent numbers, and if there is a significant change in the proportion of dwellings that are consented but not then built, Statistics NZ will not pick this change up. Secondly, if the rate of scrappage or demolition of existing dwellings changes, Statistics NZ is unlikely to adequately capture the change in its numbers either.
Splitting the dwelling stock into occupied and unoccupied dwellings is an even more problematic process, and figures following previous censuses suggest that Statistics NZ generally continues the trend in vacant dwelling numbers from the previous five-year period, given the lack of any other information on vacancy rates.
Fewer people and fewer households
Table 5.2 compares the 2013 census night numbers with the regular estimates published by Statistics NZ (benchmarked at the 2006 census). Table 5.2 also shows our adjusted estimates of the population and dwelling stock, calculated by applying the census data growth rates for population and dwelling numbers to the estimates for 31 March 2006. At this stage, this final column probably gives the best indication of where Statistics NZ’s previous estimates of the population and dwelling stock have gone astray.
Table 5.2
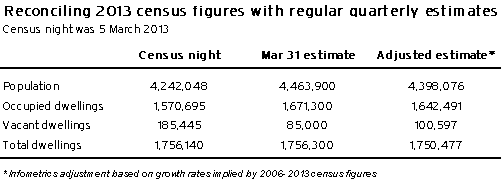
Our assessment is that Statistics NZ has overestimated growth in New Zealand’s usually resident population by about 65,800 people, or 1.5%, since the 2006 census. Slower population growth would normally imply weaker growth in underlying demand for new houses, suggesting an oversupply of property, but Statistics NZ also looks to have overestimated growth in the number of occupied dwellings by 28,800, or 1.7%. The number of vacant dwellings may have risen by more than expected over the last seven years, but at 5.7%, the vacancy rate is no worse than it was back in 2001. Indeed, the drop in the vacancy rate between the 2001 and 2006 censuses was unusual, and we are not surprised that the 2013 census data suggests that this decline has not been sustained.
The regional breakdown at 2013
So at a nationwide level, the census figures suggest that relativities between the population and dwelling stock are not too much different from what had previously been thought. However, analysis over the last few years had suggested that there were significant variations in the supply and demand equation around different parts of the country. Specifically, Auckland and Canterbury had been identified as possibly having major undersupplies of housing – Canterbury because of the 2011 earthquakes, and Auckland because of relatively low levels of building activity since 2005.
Graph 5.1
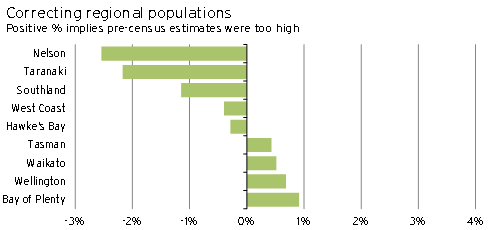
Graph 5.2
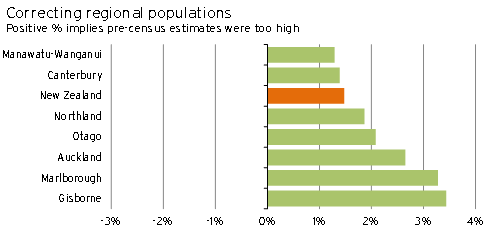
Graph 5.1 and Graph 5.2 show the gap between implied population growth from the census figures and previously published annual estimates by Statistics NZ. The graphs show that Statistics NZ overestimated the population for most regions around the country, with Nelson, Taranaki, and Southland the biggest exceptions. The 2.7% overestimation of Auckland’s population was one of the biggest in the country, and was only smaller than the overestimation for the relatively minor regions of Gisborne and Marlborough.
We have also previously done work modelling the dwelling stock at a regional level based on 2006 census figures, dwelling consent data, and Statistics NZ’s quarterly estimates. In Graph 5.3 and Graph 5.4, the regional growth in the dwelling stock (total of occupied and unoccupied dwellings) from these numbers is compared with the growth implied by the 2013 regional census figures. The graphs show significant overestimates of growth in the dwelling stock in Auckland, Tasman, Canterbury1, and Bay of Plenty, but in many other regions, the dwelling stock has grown more quickly than had been thought.
Graph 5.3
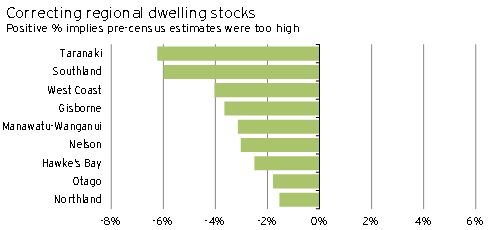
Graph 5.4
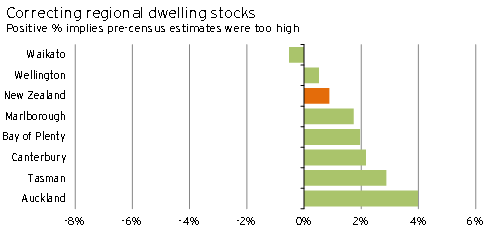
Taking the population and dwelling stock figures together, there looks to be more pressure on the dwelling stock in Tasman, Bay of Plenty, Auckland, and Wellington than we had previously estimated2. The Auckland result is perhaps most critical given the amount of discussion and policy work that has been devoted to the region’s housing shortage, and expectations that increased residential construction work in Auckland will be a significant driver of growth over the next 2-3 years.
Population under- and over-performers
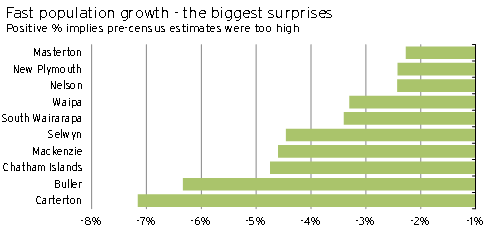
Finally, it is worthwhile highlighting the local authority areas where population growth has been most at variance from the figures previously estimated by Statistics NZ. Graph 5.5 shows the ten areas where the gap between census and previously estimated population growth was the greatest. These included:
- Waipa, gaining people that otherwise looked like they had moved to Hamilton
- New Plymouth, part of the strongly growing Taranaki region
- the three Wairarapa districts, gaining people that had been estimated to be living in the Wellington urban areas
- Selwyn, gaining people from Christchurch.
Graph 5.5
In contrast, Graph 5.6 shows the ten areas where the previously estimated population growth fell short of what the census data has shown us. There are some significant urban areas in this group where population growth has been on the disappointing side, including Christchurch, Dunedin, and Palmerston North.
Statistics NZ plans to publish new national and subnational population estimates, based on the 2013 census, in August 2014. Following the release of this data, we will analyse the new figures to determine whether our understanding of regional population and dwelling stock pressures still holds true.
At this stage, the most important message we can take from the data is that pressure on the dwelling stock in Auckland appears to remain in place, even if the region has experienced slower population growth over the last seven years than had previously been thought. As such, our view on prospects for increases in house prices and residential construction in the region over the next 2-3 years remain in place.
Graph 5.6
1 Previous estimates of Canterbury’s dwelling stock had made no adjustment for dwellings lost in the 2011 earthquakes, in line with Statistics NZ’s decision not to immediately adjust its nationwide dwelling stock figures for the effects of the quake.
2 Canterbury also has more of an undersupply than the headline numbers would have suggested, but this outcome was anticipated due to the 2011 earthquakes.