Measuring school performance
The prospect of measuring school performance by testing students to national standards has upset many teachers and educationalists. There seem to be three main fears:
- Labelling achild as a failure is not going to improve their learning.
- Teachers willteach to the test, resulting in students receiving a narrower education.
- Schools will beunfairly compared with one another.
The first concern really has nothing to do with national testing and can be easily addressed in the classroom. Especially at primary school level, the main role for testing is the formative assessment of student progress – an iterative process of measuring how individual students are progressing and designing programmes that meet their individual needs and learning styles.
Teaching to the test is indeed a retrograde step if those tests are predictable and formulaic. Modern testing systems such as asTTle (Assessment Tools for Teaching and Learning), however, consist of a databank of thousands of questions with the option for teachers to select random questions stratified by degree of difficulty and by subject sub-component, such as algebra or comprehension. The probability of two tests being the same is remote, meaning that 'teaching to the test’ as we currently understand it is virtually impossible.
To an economist the third concern raised above is more interesting. Comparisons between schools need to be based on value-added, something that economists a
reused to measuring. Value-added is a critical concept. We don’t assess a company’s performance by its gross value of sales. We net out what it pays for its inputs so that we can assess how much value it is adding to those inputs. Our standard of living depends on allocating resources to those industries that can use them most efficiently. This applies to schools too. As taxpayers we want to see schools securing the highest possible academic achievement from their students, thereby giving them more choice about career options and eventually contributing to raising our collective quality of life. (I assume for the moment that academic achievement is the sole criterion of a school’s success.)
Comparing the raw academic results of a decile 10 school with those of a decile 1 school is unlikely to tell you anything other than that the students at the former are likely to have all the developmental and educational advantages that usually accompany high parental income, educated parents, no overcrowding at home, and so on.
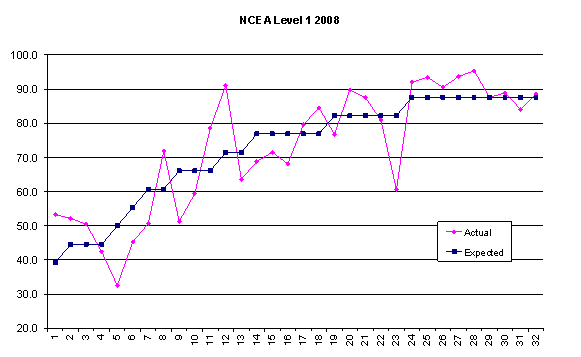
The accompanying graph shows last year’s Level 1 NCEA pass rates for 32 colleges in the Dominion Post’s circulation area. The first interesting feature of the graph is that a best fit trend through all the points is approximately linear and is upward sloping, providing a prima facie case that school decile is positively correlated with academic achievement. The second interesting feature is that there are some marked divergences from the trend. For example School 23 appears to provide much less value-added than would be expected purely on the basis of its decile rating, whilst School 12, a decile 7 school, performs better than expected and indeed better than some decile 10 schools.
Hence a first approximation to a school’s value-added is the distance between the actual result and the statistically fitted trend line. But in this simple model all schools in a given decile are treated as having identical student bodies, which is clearly not true. Other potentially important factors should be included in the model. For example:
- Insufficient gradation in the decile rating. How similar are students in the 91stand 99th percentiles?
- The variability within a school’s decile rating may be as important as the average. Two schools could have the same average decile, but one could be much more homogeneous in terms of its mix of students than the other, perhaps providing an easier teaching environment.
- Size of school -do larger schools allow gains from economies of scale in the delivery of education, or does size detract from personal interaction between staff and student?
- Single sex orco-educational.
- Small sample limitations – data across all secondary schools in New Zealand would yield more robust inferences.
- Variation overtime – a single year may be unrepresentative for any given school because of particular circumstances in that year.
Accordingly a number of refinements would be required before an accurate measure of a school’s value-added can be established. This presents a challenge to education researchers and to the media who report exam results. Trying to stop publication of school test scores or making access to them difficult is not a solution. Secrecy only instigates rumour and misinformation. Far better to make the information readily accessible and encourage researchers to compete with each other to see who can estimate the most robust measures of value-added and identify which schools really are performing best. The recent publication of data on hospital waiting times and other performance measures provides a parallel in the health sector.
And, returning to the earlier point about how school success should be defined, we may see multi-dimensional analyses that incorporate not just a school’s academic achievement, but how its students achieve on the sports field or in cultural domains.


