What is it about the Kiwi dollar?
What is it about the Kiwi dollar?
The swings and roundabouts in the New Zealand dollar were a dominating factor for businesses over 2009. The New Zealand dollar started the year in free-fall, dropping 15% over January. But after the monetary floodgates opened, the kiwi staged a massive 44% rally over the next seven months.
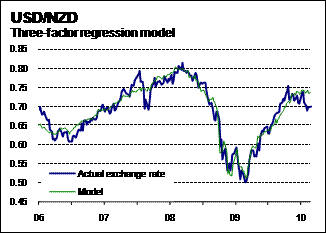
It is often said that short-term currency movements are nearly unpredictable. But that is not the quite the same thing as saying its movements are unexplainable, after the fact. And in actuality, the kiwi’s movements this year were well explained by a simple model comprising just three factors.

Graph 8.1
What does this mean exactly? Over the last four years (i.e. both before the credit crunch and after it), the kiwi’s behaviour has been consistently governed by its relationship to three factors. Once these are accounted for, the kiwi has rarely done anything surprising. To phrase it differently, the kiwi has rarely been over or under valued by the definition of the model (of course there are many possible models, a subject we shall return to below).
There is nothing especially controversial about our choice of factors.
- The first factor is the interest rate gap between New Zealand and the US. This gap captures expectations of different growth rates and inflation rates between the two countries and is a proxy for the carry-trade influence on the currency. When the rate gap is larger, the New Zealand dollar is higher.
- The second factor is the spread between high-yield (junk) bonds and government bonds in the US, which captures market risk aversion. When risk aversion is higher, investors demand greater compensation for the risk of default (in the case of currencies, this means a cheaper starting point for the currency). In a credit crisis, New Zealand is more likely to come unstuck and experience a currency run. Spreads on high-yield junk bonds are a proxy for this (and the fact that NZ Inc is accorded junk bond status should be a sobering thought!). When the spread is smaller, the New Zealand dollar is higher.
- The third factor is commodity prices, which are effectively the key determinant of earnings for NZ Inc’s tradable sector. Higher commodity prices suggest that a stronger dollar can be justified over the long-term. When commodity prices are higher, the New Zealand dollar is higher.
One implication of this model is that the kiwi could be quite successfully predicted if all of those factors could be successfully predicted. In practice, this task is not an easy one. In January 2009, with a global financial system seemingly on the verge of total collapse, who would have guessed that junk bonds would be trading normally within a year? Or that despite the worst global recession in 50 years, commodity prices would rally strongly?
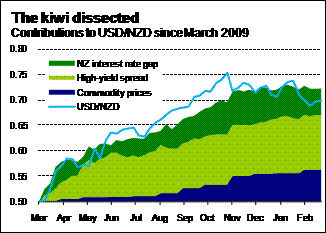
We can look at the kiwi’s 44% recovery over 2009 through the lens of the model. When we do, it emerges that there is nothing unusual about the currency’s reaction, a result that holds even if the model was calibrated only using data available up until the end of 2008.

Graph 8.2
All three factors have contributed to the climb. Commodity prices (contribution +5.0c) have lifted over the last six months as the outlook for global growth, especially in the developing world, has undergone a marked improvement. New Zealand’s interest rate gap (contribution +5.7c) has widened significantly as it became clear that the New Zealand economy was in a relatively strong position and the Reserve Bank would raise interest rates more than the US Federal Reserve in 2010. But the most significant impact on the currency has come from the healing of the credit crisis, and the corresponding reduction in risk aversion (contribution+10.8c). Investors have poured back into risky assets, pushing up prices (which manifests as a higher New Zealand dollar and lower junk bond yields).
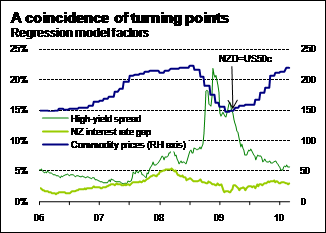
The sharp change in risk aversion is most apparent in Graph 8.3, which plots the factors over time. The spread on junk bonds fell from 15% in March 2009 to just over 5% at the end of the year – a level consistent with a completely normal credit market. And at almost exactly the same time, commodity prices reversed direction, and New Zealand interest rates started to climb. All three factors were pulling the dollar higher in unison.

Graph 8.3
This confluence of drivers is not entirely unheard of – financial variables tend to be correlated with each other. This tendency can make it hard to isolate cause and effect, or to separate the relevant factors from the irrelevant ones. For example, world stock markets do not appear in this model, despite the clear correlation with the currency on a monthly basis. In this instance, interest rates, risk aversion, and commodity prices seem to capture all the relevant information for the New Zealand dollar that is available in the movements of the S&P 500.
Where to in 2010
All financial models come with the standard disclaimer: future performance may be less thrilling than in the past. One warning sign is that the relationship described above does not fit the data as well over longer time periods. This lack of fit may mean that we are not witnessing a true relationship, or that the currency’s relationship to other variables varies over time – the market’s attention can be fickle.
Clearly there are factors that we strongly believe do matter for the currency at certain times, or over longer periods, even if they weren’t as relevant in the last four years. The Australian dollar has a strong influence on the New Zealand dollar, although including it in a model just begs the question of what explains the Australian dollar. Over the long-term, economists also believe that fundamental factors guide exchange rates. Namely, the currency needs to be at a level where the current account deficit is sustainable – a dubious proposition at current levels in New Zealand. Purchasing power parity also plays a part – a basket of tradable goods should cost roughly the same in every country once exchange rates are allowed for.
But let’s assume this model holds for another year. Our first observation would be that risk aversion has almost returned to normal, and that, even in a climate of very easy monetary policy, we see little room for it to fall further. So there is little remaining support for the dollar from this avenue.
The interest rate gap is harder to predict. Current market rates already price in tightening in both New Zealand and the United States, and the interest rate gap between the two is already above average. But our view is that New Zealand, unlike the United States, has some risk of an overheated housing market and an inflation problem by the end of 2010.
Finally, commodity prices are not going to sustain their hot streak of the last six months, but prices will keep rising on the back of strong economic recoveries in developing economies. Low interest rates in the major economies will be a second source of stimulus.


