Public transport use in key urban centres
Public transport use in key urban centres
The 2013 census showed that the proportion of those travelling to work via bus or train was 5.7%,1 up from 5.2% at the 2006 census. Public transport is a significantly more prominent travel option in regions with a high enough population density to support its use. This article will focus on the key aspects of public transport growth in the three key centres of Auckland, Wellington, and Christchurch, and looks at where further linkages could be developed to provide better connections between work and home.
Wellington
Public transport use is most popular in the Wellington region, with 17% of those travelling to work using either a bus or train to do so. These forms of public transport are well established in Wellington, but have nevertheless expanded steadily over the past two decades. In 2013, approximately 9.5% of commuters2 took the bus to work, while 7.7% took the train (compared to 9.0% and 7.1% respectively in 1996).
The increase in public transport use is largely derived from a transition from motor vehicle use as a means to get to work to either public transport or “eco-friendly” travel (by foot or bike). A strong push by train and bus operators and Greater Wellington Regional Council to lift patronage numbers has seen ongoing improvements to the bus and train networks. These include new trains and buses, as well as the Snapper prepaid swipe card system introduced by Infratil in June 2008.
Graph 5.1
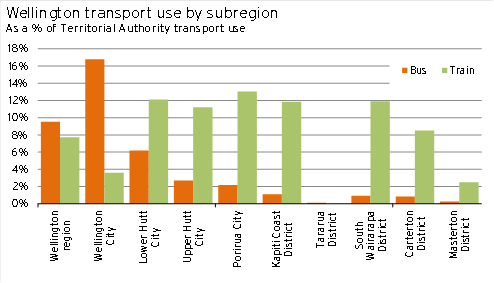
Ease of access to public transport linkages is an important factor in the level of public transport used. The highest rate of bus use occurs in the Wellington City area, where bus routes are more numerous and the distance to one’s workplace is often shortest. One in six of the area’s commuters take the bus to work – the highest rate of any territorial authority in the country.
Bus connectivity is heavily reliant on population density to provide enough patronage for pick-up points. As opposed to trains, which travel more quickly over long distances and therefore attract patrons to fewer key pick-up points, bus availability and use deteriorates rapidly in areas with more widespread populations (see Graph 5.1).
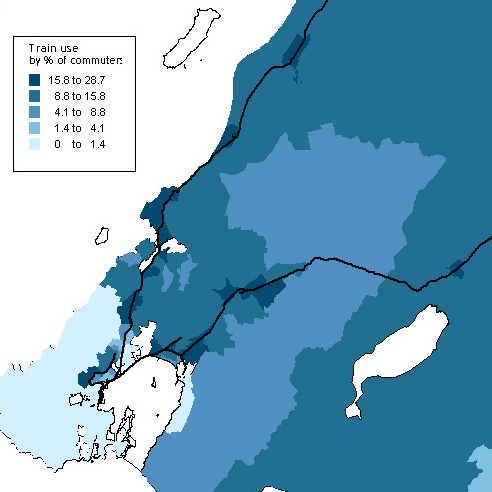
Around 90% of train users work in the city area, with the majority of these users travelling from surrounding territorial authorities. The popularity of train commute is largely irrespective of the distance travelled to get to the city. Of commuters based in the surrounding territorial authorities from as close as Lower Hutt to as far as the South Wairarapa and Carterton between 9% and 13% take the train. Not surprisingly, the bulk of train commuters stem from suburbs directly around train station points (see Figure 5.1).
Figure 5.1
Auckland
As at the 2013 census, 8.3% of commuters in Auckland used either a bus or train as their main mode of transport to work – one fifth more than at the previous census in 2006. Both types of public transport use, as a proportion of commuters, increased over the period – the proportion of bus users climbed to 6.5% and train users to 1.8% (up from 5.8% and 1.1% respectively in 2006). Auckland also has a well-established ferry system that supports commuters between the CBD and various locations around the Waitemata Harbour.
As the city grows, it will become increasingly important to facilitate key commuter catchment areas and destination points with public transport services.
Urban sprawl
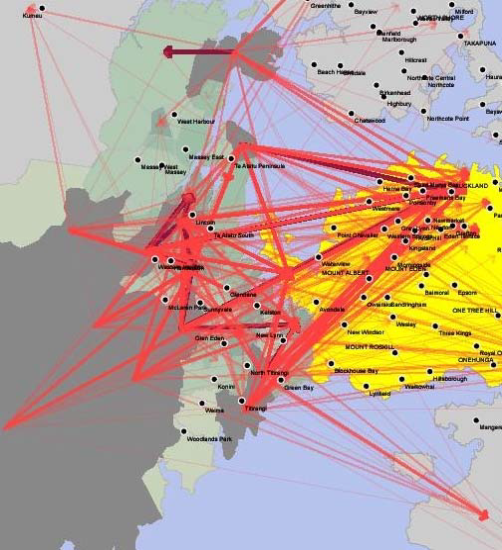
Even so, the sprawl of Auckland City both in terms of residential location and, more importantly, workplace location, negatively affects public transport usage in the city. Despite there being a big enough population to patronise large-scale transport systems, trains are only used by a small fraction of commuters in Auckland. Buses, although more popular among commuters, are still underused relative to Wellington. These outcomes are caused by commuters lacking a common travel route to work. For example, Figure 5.2 shows the connection between commuter residence and workplace locations for Waitakere City in 2006. With so many different commuter routes, it is difficult to have a public transport system in place that would adequately service the needs of more of the population. A similar story holds across the rest of the Auckland urban area.
Figure 5.23
Public transport works best when users have a common destination when travelling either to or from work. In Wellington, most transport lines end up where the majority of the population works – in Wellington City. Having these congregation points enables public transport systems to funnel users directly, or very close, to their desired destination.
The effectiveness of a transport system to get commuters easily to and from their workplace results in higher usage rates. Graph 5.2 highlights that in the Waitemata and Gulf ward, where 23% of Auckland commuters work, both bus and train transport use is significantly higher than for other workplace locations.
Graph 5.2
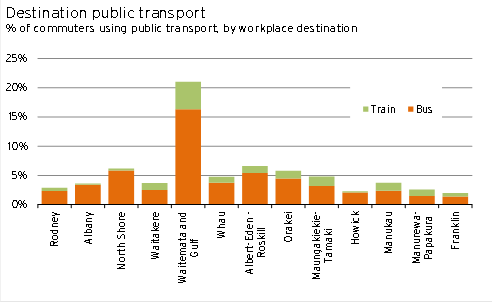
The Maungakieke-Tamaki, Manukau, Albany and North Shore wards contain workplaces for the next highest proportions of commuters (between 8.7% and 11%), but only about 5% of commuters use public transport to get there.
However, redevelopments and a changing management structure have still resulted in an increase in train patronage, and thus public transport use, over the past three years. For example, the introduction of the direct Manukau to Britomart train line in April 2012 resulted in a 23% jump in southern and eastern line passengers over the first year. Continued new developments, such as the introduction of electrified trains in April this year and the free Wi-Fi on trains currently under trial, are likely to increase passenger numbers in the years ahead.
The Waikato connection
High population densities are less important for train lines than for bus use, but there still needs to be a commuter base from which train lines can operate. In the 2006 census, the number of people commuting from Hamilton City and Waikato District to Auckland was 1,119 people. As there is no frequent public transport link between the two cities, most of these commuters would have travelled by car, but this trend could soon change.
With Auckland house prices flying further outside the range of affordability for the average household, and with houses in the Waikato District and Hamilton City areas being substantially more affordable, the employed population of these two regions has grown by 3.9% over the 2006-2013 period. These strong rates of employed population growth are likely to have seen the number of commuters between Hamilton and Auckland increase.4
With the infrastructure already in place (currently catering for freight and the three-times a week Northern Explorer train), supporting these commuters via rail would require little more than adding to the rolling stock.
Christchurch
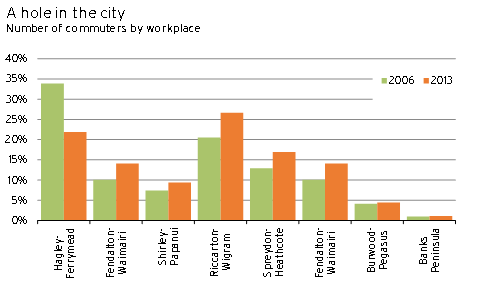
Public transport use in Christchurch as a proportion of commuters has diminished over the 2006-2013 period. Although already relatively low for a city that size, bus users as a proportion of commuters dropped from 3.7% in 2006 to 2.6% in 2013. With the destruction of the CBD by the February 2011 earthquake, workspaces largely shifted to less damaged suburbs (see Graph 5.3). As widespread commuter destinations are less efficiently serviced by public transport, commuters have turned back to motor vehicle use since the earthquake.
Graph 5.3
This trend is not expected to continue. As the city is rebuilt, workplace locations are likely to shift back into the centre of town where public transport systems can better service the population. However, in the interim, there is an opportunity to connect out of town commuters directly to city by rail. As with Waikato, train lines in Christchurch currently service freight and tourism, but could be used for commuter services by adding to the rolling stock, upgrades to existing stations, and the possible construction of a few new suburban stations. We note, however, that significant government subsidies would be necessary for a train service in Christchurch, given the extent of central government’s contributions to the services in Wellington and Auckland
Train lines from Rangiora in the north, Lyttelton in the southeast, and Rolleston in the southwest all convene in the city. Trains could either stop at the current station in Addington, or a new station could be built closer to Riccarton where there are better bus links to other parts of the city.
Bettering the public transport system
In summary, the opportunities to improve public transport systems lie primarily in route connectivity between residential areas and workplaces. The Wellington public transport system is the best example in New Zealand of this connectivity, with bus systems servicing shorter distance travel and train lines linking nearby urban areas to the Wellington City centre.
Due to its more diverse web of movements between home and work, Auckland’s public transport use rates are far lower than in Wellington, but recent upgrades to the train network are likely to improve public transport use on key corridors. Furthermore, these upgrades will enable planners to concentrate higher passenger volumes along train lines – potentially freeing up bus services, which previously connected these sites, for shorter distance travel.
Christchurch City currently has a similar problem to Auckland. However, as the central city is rebuilt, and workplaces return to the city centre, better connections between residential areas and workplaces can be made. The rebuild of Christchurch provides an opportunity to enhance connectivity and public transport use.
1 For the purpose of this article, public transport will be defined as bus or train transport.
2 Employed persons over the age of 15 travelling to work via bus, train, motor vehicle, foot, bike or other (ferry, taxi, aeroplane etc.).
3 Figure 5.2 is a view of commuters in and around the Waitakere City area. The thick red lines represent higher commuter volumes travelling between two points (residence and workplace). Source: Statistics NZ: Commuting in Auckland report, July 2009.
4 Official 2013 census figures on this variable are not yet available.


