Road Trip down Memory Lane
New Zealanders have a passion for cars. With the exception of the US, our love affair with the automobile has led to New Zealand having more cars per head of population than anywhere in the world. The car industry is very different to how it once was back in the late 1980s. The significant changes to regulations around importing vehicles have influenced New Zealanders’ consumption of cars.
Farewell tariffs
During the early 1980’s the relative cost of car ownership was expensive. The high price of buying a vehicle resulted in a high proportion of income being spent on cars and vehicle-related expenses. High prices were spurred by restrictions on the importation of Completely Built Up (CBU) vehicles and high tariffs associated with importing Completely Knocked Down (CKD) vehicles.
Between 1984 and 1988 the tariffs on CKD vehicles were reduced and then abolished in July 1988. At the same time, a 35% import duty was kept on CBU vehicles to protect New Zealand’s car assembly industry. The removal of the restriction on the importing of CBU vehicles gradually led to the phasing out of the local assembly of passenger cars.
Reductions in tariffs and regulation changes also led to relative price falls for cars during the 1990s. In 1990 the excise duty on cars was abandoned and the tariff on CBU vehicles was slowly reduced before the government announced the immediate withdrawal of all tariffs on virtually all motor vehicle imports in 1998.
Car consumption climbs
Changes to these tariffs led to the relative price of used cars declining by 36% between December 1987 and the start of the 21st century. The benefits associated with the price falls over this time were largely felt by first-time car buyers, whereas those who already owned vehicles saw massive depreciation on their asset, offsetting some of the price fall.
In terms of private vehicle ownership, consumers spend a greater proportion of their income on the purchasing of cars than they do on petrol. In other words the depreciation cost of a vehicle is greater than the petrol costs associated with owning a vehicle. Therefore declines in the purchase price of cars have a greater effect on the overall ownership costs than the same proportional decline in the price of petrol would.
The price falls must be viewed with some caution though as the car price indices published by Statistics NZ are adjusted for improvements made to the cars. Cars continue to develop and gain additional features (such as ABS, airbags, etc). The index is adjusted for improvements, the intuition being that you get more for your money. So this could signal that the dollar value of cars hasn’t changed as much as it appears because of the increase in the features included in new cars, which are effectively accounted for as a price fall.
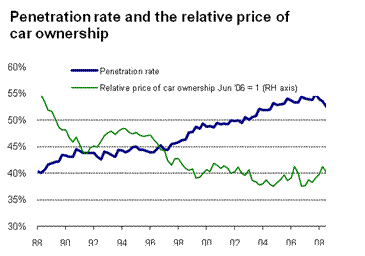
Graph 1
Since 1987 the proportion of income spent on vehicles and vehicle-related expenses has been relatively steady, averaging 11.5% of total household expenditure, down from an average of 13.7% prior to 1987. Due to fluctuations in petrol and car prices, the relative price of car ownership is more volatile than the penetration rate (number of cars per head of population), but there is a correlation between the two. The trend has seen the price of car ownership decline, and with this we have effectively consumed more cars and kept the proportion of our spending roughly the same, raising the penetration rate. In December 1987 there were 0.40 cars per head of population; this reached an all-time high of 0.55 in December 2007 before the onset of the recession, a 38% increase.
The scrap heap
The introduction of imports in 1988 has had an effect on the scrap rate of cars. The lower replacement price and the shorter lifespan of imports means they are scrapped more frequently than when new cars dominated the market. The annual scrap rate climbed from 2.9% in June 1989 to 7.0% at the end of 1991, spurred by the economic recovery following the 1987 crash.
Replacement demand is a large source of underlying demand. As the scrap rate increases so does this source of demand and it exists even when the size of the fleet is not growing. Between 1995 and 1997 the car fleet grew by 5.3%, or 87,860 cars. Over the same period there were 479,505 new registrations, meaning that 391,646 cars, just under a quarter of the car fleet, were consigned to the scrap heap in just two years.
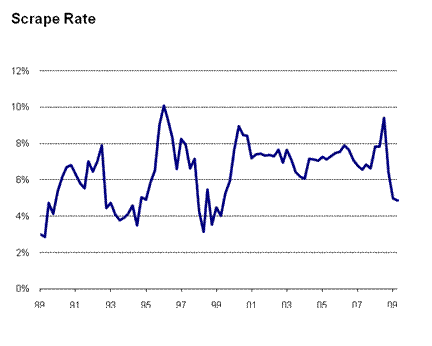
Graph 2
The health of the economy has an effect on the scrap rate as well, as during good times people are more inclined to replace their car. Between 1997 and 1999, during the Asian Crisis, economic growth was poor, corresponding with a reduction in the scrap rate as owners struggled to afford new vehicles and instead hung on to their old cars. Again, the effects of the current recession are evident, with the scrap rate undergoing a sharp decline. The annual scrap rate had sat within the 6-8% band for every quarter between March 2001 and June 2008. It then rose to 9.4% in September 2008, but has since plummeted. As of June 2009 the annual scrap rate was down to 4.9%.
Aging car fleet
The graph below shows the change in the number of cars by year of manufacture between 2004 and 2005. In 2005, there were more cars for each year of manufacture after 1994 than there had been in 2004, as a result of used imports entering the country. For cars produced prior to 1994 (12 years and older), the number of cars scrapped outweighed any new additions to the car fleet from used imports. Historical data shows that 12 years old has been the turning point (where the scrapped number of cars outweighs new additions to the fleet) every year since 2000.
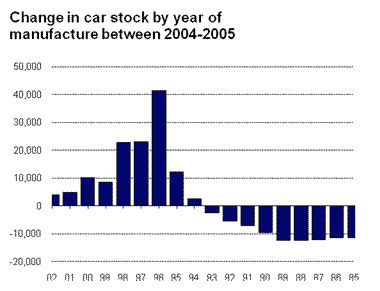
Graph 3
The graph also shows a large number of cars produced in 1996being added to the car fleet. This spike was due to the introduction of new frontal impact standards in 2002. Cars produced in 1996 were generally the oldest cars to met the new standard so there was a large influx of cars manufactured in 1996 over the following few years. By 2007 there were 260,509 cars that were manufactured in 1996, accounting for 10% of the total car fleet, and 52,000 more cars than there was for any other year of production.
New Zealand’s car fleet has aged every year since our dataset began in 1998 when the average age was 11.20 years – by 2008 the average age had climbed to 12.55 years. This spike of cars manufactured in 1996 is helping to increase the average age of the car fleet over time. But now that this spike of cars is older than 12 years of age, these cars are likely to be scrapped at an increasingly rapid rate, which could add to replacement demand for cars.
Conclusion
Historical data shows that the increased ease of importing cars and the abolishment of tariffs have boosted the affordability of car ownership in New Zealand. The relative price of car ownership has declined, and this change has stimulated an increase in the penetration rate within New Zealand.


