A stress-free LTP: spotlight on Southland
Councils nationwide have begun preliminary work scoping out key issues for their 2018 Long-Term Plan – a document that sets out each Council’s intentions for the next decade. The LTP process is an arduous one that puts the focus on localised issues affecting infrastructure, business and community development across all townships and communities within each territorial authority.
For hardworking council staff, the granularity of data required to complete this exercise adds to the stress of the work. Not only must staff understand the size and state of their council’s existing asset footprint, but they must understand how the economic and demographic context of each community differs within their jurisdiction.
The types of questions we frequently hear at Infometrics include:
- Which towns, suburbs and rural communities in my area are expanding/contracting in terms of economic and employment prospects?
- How does this growth compare with history and with other parts of the district?
- Which industries are creating jobs and where are they in the district?
- Are changes in jobs prospects affecting population growth around the district?
To help answer these questions, we have developed small area profiles that give decision makers in the provinces the ability to get detailed economic and labour market insights of each small area within their jurisdiction. In an upcoming refresh of the small area profiles, we will also begin including demographic data.
These profiles can help provide the necessary evidence basis for any significant planning and infrastructure decisions in your LTP.
Southland District: A Case Study
Southland District provides an interesting case study for teasing out sub-district insights from Infometrics small area profiles.
Over the past decade Southland District has confounded predictions by Statistics New Zealand that its population would decline.
Instead, off the back of improving job prospects throughout the primary, manufacturing and tourism sectors, Southland District’s population grew from 29,200 in 2006 to an estimated 30,900 in 2016.
Nevertheless, economic prosperity and population growth were not spread evenly throughout the district, with some communities thriving, while others were sluggish.
For example, the populations of Riverton, Te Anau, Winton, and Edendale grew from a combined 6,930 in 2006 to an estimated 7,420 by 2016.
But over the same period, the populations of struggling towns such as Nightcaps, Ohai, Otautau and Tuatapere declined from a combined 2,050 in 2006 to an estimated 1,910 in 2016.
A lack of job prospects in parts of South-Western Southland and the effects of aging populations were key factors behind these diverging sub-district trends.
Infometrics small area profiles allow us to tease out employment insights in these areas in more detail.
Over the past three years, job numbers in Southland District grew by an average of 1.5%pa, just below nationwide growth of 2.4%pa.
There were 17,292 jobs in Southland District in 2016, compared to 16,545 jobs in 2013.
But as with population growth, this job growth was not evenly spread throughout the district.
Job numbers in Te Anau grew by an average of 3.5%pa over the three years to 2016 due to soaring tourism activity, while employment in Winton grew at a healthy rate of 3.1%pa over the same period.
Employment in Edendale soared more than 50% in 2010/11 following an expansion of Fonterra’s dairy factory and has continued to creep higher, with job numbers rising by an average of 1.3%pa over the past three years.
At the other end of the spectrum, employment prospects in Nightcaps, Ohai, Otautau and Tuatapere have continued to deteriorate, falling by an average of 0.8%pa between 2013 and 2016. A range of industries declined as demand in these communities weakened following the cumulative effects of severe job losses in the wood processing and mining sectors over the past couple of decades.
To put the situation of these towns in South-Western Southland in perspective, in 2004 there were more than 1,000 jobs in these towns, but that number is now well below 700.
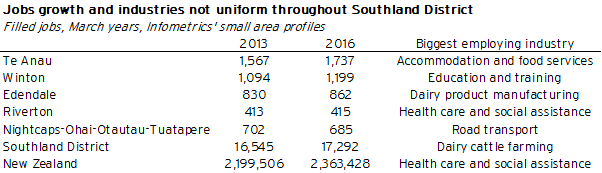
The table above summarises these employment trends in Southland District, along with the name of the biggest employing industry in each township.
What about your area?
The Southland District case study described above, highlights the challenges faced by councils when considering sub-district issues during LTP process.
Remember you are not alone when dealing with these issues – so don’t go reinventing the wheel unnecessarily.
Infometrics small area profiles are helping a range of councils nationwide come to grips with the ins and outs of their local economy.
For example, profiles of Queenstown and Wanaka help Queenstown Lakes District Council understand the complex planning challenges of explosive growth in two very different towns.
We also help the capital city understand how jobs growth in Wellington’s CBD compares to the performance of Wellington City as a whole.
At the other end of the county, Far North District Council has access to profiles of its community boards, which help staff understand the composition of growth in Bay of Islands-Whangaroa and the challenges faced in Kaikohe-Hokianga.
At Infometrics, we can make sure that you and your team have the necessary frameworks in place to support your LTP work over the coming year.
If you have any questions regarding how you can better understand the communities within your district, then please contact Benje Patterson (benjep@infometrics.co.nz) for more details.