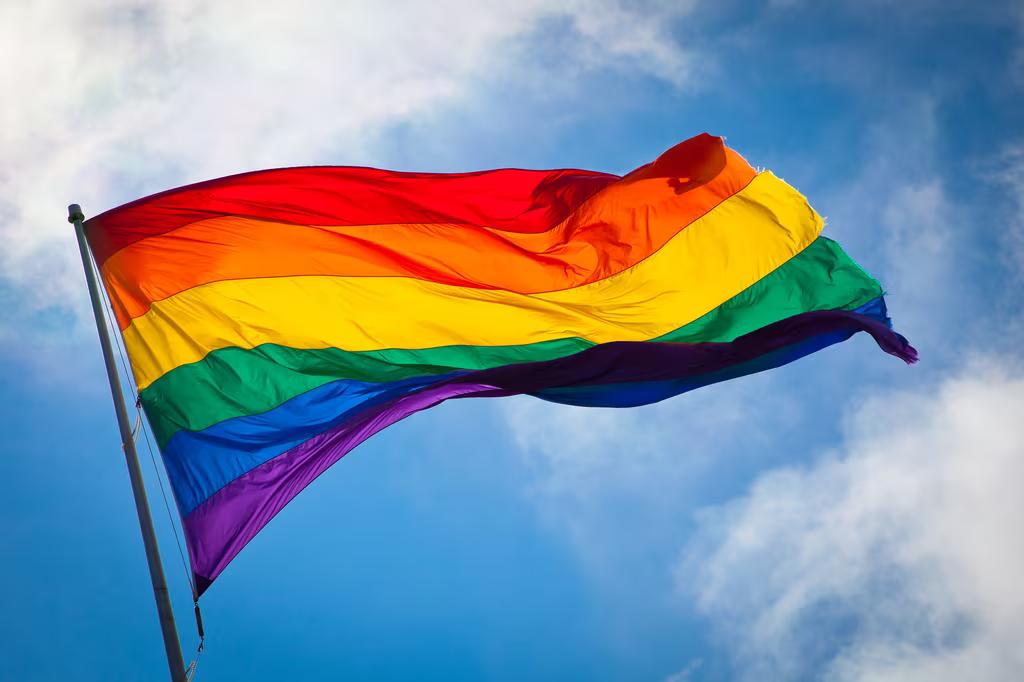
For the first time, Stats NZ has been able to produce detailed and statistically robust estimates of counts and outcomes of New Zealand’s rainbow community. Many of the headline results confirm expectations from the community itself, but nevertheless provide a statistical foundation from which to better understand, and target better outcomes for, New Zealand’s rainbow community.
To provide the best support to various parts of New Zealand, it’s important to understand and analyse how outcomes differ by group. That’s why many in New Zealand look below headline statistics to measure, examine, and analyse outcomes across regions, ethnicities, ages, and a wide range of demographics. But until late 2021, New Zealand’s rainbow community didn’t have any reference data from which this understanding could be built. For the first time, Stats NZ questions in the 2020 Household Economic Survey (HES) provide a basis for this analysis. The analysis showed around 1 in 20 Kiwis identify as LGBT+, the first comprehensive statistical evidence to help shape New Zealand’s understanding of the rainbow community.
Stats NZ’s release is comprehensive, and well worth examining. Here, we outline several analyses derived from the LGBT+ population data.
Higher unemployment for rainbow Kiwis
New Zealand’s rainbow community has a strong level of participation in the labour force, with only 22% of the LGBT+ population not in the labour force, compared to 28% for the non-LGBT+ population. However, that higher level of participation is due to a considerably higher unemployment rate. In 2020, an estimated 6.7% of the LGBT+ population labour force was unemployed, a considerably higher unemployment rate than the 3.9% recorded for the non-LGBT+ population (see Chart 1).
This higher unemployment rate for New Zealand’s rainbow community comes despite the LGBT+ population having a higher level of education than the non-LGBT+ population. In 2020, around a third (33%) of the LGBT+ population had a qualification of Level 7 or above (Bachelor’s level and above), compared to 26% of the non-LGBT+ population (see Chart 2).
The younger age profile of the LGBT+ community (see end section) is likely to partially explain some of these labour market and education outcomes, with younger age groups tending to have higher participation and education attainment.
Wellington has highest rainbow population concentration in NZ
New Zealand’s rainbow community is more focused in urban areas, with 4.5% of New Zealand’s urban population estimated to be LGBT+, compared to 2.8% of people in rural settings. This urban focus is confirmed by the larger population concentrations of the LGBT+ community in Wellington, Auckland, and to a lesser extent Canterbury. Northland and the East Coast also stand out as areas where a higher share of the total population identify as LGBT+. Wellington’s position as New Zealand’s rainbow capital is firmly entrenched, with 6.3% of the region’s population estimated to be LGBT+.
These regional concentrations are reinforced when examining the regional LGBT+ population distribution to the entire regional population distribution. Wellington region accounts for around 11% of the entire New Zealand population, but 16% of the LGBT+ population.
Rainbow community concentrated in younger populations
Perhaps unsurprisingly, New Zealand’s LGBT+ population makes up a larger proportion of younger cohorts, and skews considerably younger than the total population. In 2020, over 8% of New Zealanders aged 18-29 identified as LGBT+, around double the total ages average of 4.2% (see Chart 4). In the reverse, those aged above 35 are less likely to identify as LGBT+ relative to the national average.
The younger age skew in the LGBT+ group is considerable, and a mirror image of the total population (which is skewing older). In 2020, nearly two thirds (62%) of the LGBT+ population was aged below 40, compared to 39% of the non LGBT+ population. Only 8% of the LGBT+ population was aged 65+, compared to 20% of the non LGBT+ population.
Better information on groups in NZ allows greater responsiveness
Having better statistical information on New Zealand’s LGBT+ community is important to plugging data gaps that can leave decision makers and local communities in the dark about who and where different groups are located, and how to target support where needed. More comprehensive information is expected to be collected in the 2023 Census, which will allow for an even more detailed insight in New Zealand’s LGBT+ community.
As we get more data on New Zealand’s different communities, more detailed policy interventions can be designed, informed by our greater understanding of the people in a community, and what their current life outcomes are.
Without this information, it’s difficulty for some groups to see themselves in New Zealand society. And often even harder to get challenges recognised and support made available.
