Aging New Zealand
The tidal wave of retirees is upon us. The proportion of the workforce in the 45-64 age bracket is as large as it is going to get, while the fraction of the population that has reached retirement age is expected to double in just over a decade. In this article we outline some of the likely effects of this change.
With the baby boom kicking off in 1945/46, 2010/11 represented the start of the wave of baby boomers retiring. Over the next 30 years, this wave of retirees will have a significant effect on the New Zealand and global economies. Furthermore, the lower fertility rates that have been experienced in New Zealand over recent decades will also lead to fundamental economic and social changes.
The aging population, longer lifetimes, and lower fertility are going to have a significant effect on a number of elements of the New Zealand macroeconomy over the next 50 years. These areas include demographic changes, the change in wages and business capital stock, changes in financial conditions and asset prices, and finally the sustainability of government finances.
Dependency ratios and the age of the workforce
This section covers the expected changes in the age of the workforce and the number of “dependents” (people who are outside of the working-age population and so rely to some degree on taxpayer funding).
Summary points
- There will be a lift in the number of dependents per worker from now until 2031. Dependency ratios will stay elevated from there.
- The structure of dependents will continue to change, with more old-age dependents than youth dependents.
- The average workforce will remain older than it had been prior to the early 2000s.
- Between 2021 and 2036, more of the older workforce will be nearing retirement (55-64) than in their prime working years (45-54).
- There will be increasing participation and employment of those over 65.
The working age population (aged 15-64) provides the vast majority of the labour input required to create goods and services. From an income perspective, this group not only funds their own consumption and savings, but their income is also used to fund goods and services for dependents – either within the family or household, or through redistribution by central government via taxation.
As a result, dependents of those in the workforce include both the young (aged under 15) and old (aged 65+) categories.
Looking at the aggregate size of the dependent population relative to the working age population, Graph 5.17 indicates that between 1951 and 2061 there are five clear periods.
- 1951-1971: the dependency ratio was around 1.5 workers per dependent.
- 1971-1986: the dependency ratio rose strongly, reaching 1.9 workers per dependent.
- 1986-2016: the dependency ratio remained steady at around 1.9 workers per dependent.
- 2016-2031: the dependency ratio will slump, reaching 1.5 workers per dependent.
- 2031-2061: the dependency ratio stays at around 1.5 workers per dependent.
Graph 5.17
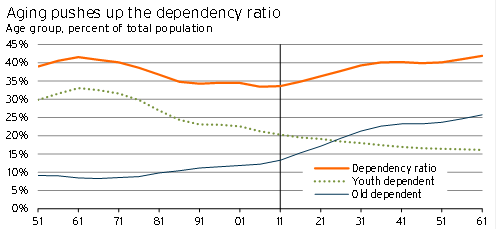
As a result, we are entering a period where an increasing number of individuals will be, in some sense, dependent on a relatively smaller group of employed individuals who provide goods and services.
It is also worth separating out the change in youth dependency and old age dependency. Outside of the very early years of life, the health costs of young dependents tend to be lower than old dependents. Furthermore, the family benefits given for young dependents tend to be less than the national superannuation paid to old dependents.
However, unlike most young dependents, a significant proportion of older dependents can enter the labour market, if remuneration is attractive enough, thereby creating goods and services and reducing or eliminating their dependency.
So even though dependency ratios are heading back to where they were in the 1950s, the effects on society and government policy from this change will be very different.
Workforce aging
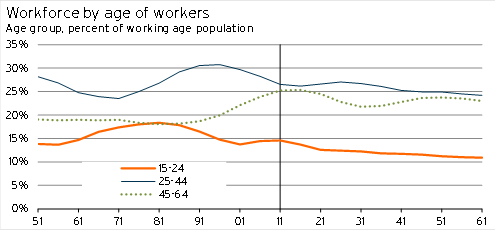
Much of the movement in the relative age of individuals within the workforce has already occurred over the past two decades. For a given size of the workforce, the “aging” that has occurred within this group (in 15-64 year olds) has mainly worked its way through (see Graph 5.18).
The one area left within the working age population where there is scope for a significant shift in the next ten years is within the 45-64 year old category. Generally, employees in the 45-54 year age bracket are seen as being in their late-prime earning years. However, by 55-64 workers are assumed to be moving towards or preparing for retirement, and are significantly more likely to leave the labour force (due to disability or the decision to retire).
In 2011, 14.0% of the population was in the 45-54 age category and 11.2% were in the 55-64 age category. By 2021, the 55-64 age group is expected to have grown larger than the 45-54 age group – accounting for 12.4% of the population as opposed to 12.1% for the 45-54 age group. This bulge filters out of the data by 2036, but also corresponds to a significant lift in the number of retirees.
While New Zealand is awaiting this shift, it has already been underway in the United States. Growing numbers of individuals in the 55-64 age bracket provide a partial explanation of the sharp drop in the US participation rate between 2008 and 2014.1
Graph 5.18
With the population aging, there is a growing role for those aged 65 and over to be tempted back into the labour market – something that has been taking place over the past 15 years.
Graph 5.19
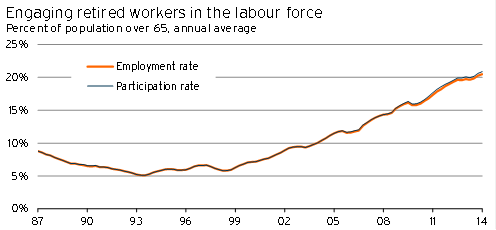
With the health of older workers improving, and the changing economic climate providing an incentive for their return (or at least their retention), there is an ever-increasing scope for further increases in employment of those over the age of 65. Firms that can offer flexible arrangements for this growing workforce will find they have a much larger pool of potential applicants for new jobs.
It is important to note that, although the baby boom has an effect on dependency ratios and the size of different age cohorts inside the workforce, it is the lower fertility rate combined with long lifetimes that has a much bigger effect on the structure of the workforce and population. Although the baby boom is only temporary, these other factors are expected to be permanent – implying that New Zealand is heading towards a new “normal” with respect to the way firms and households must be structured.
Wages and the growing importance of capital
This section covers the expected in labour market conditions and the rising importance of capital.
Summary points
- More scarce labour (relative to capital) will see wages rise.
- There will be greater overall utilisation of capital by firms.
- There will be an incentive for greater investment in “labour-saving” technology over the next 50 years.
An aging population with lower fertility rates changes the structure of the broader macroeconomy, through its effect on both population growth and labour market participation.
Most discussions of an aging population are focused on the costs of superannuation or the effects on asset prices and interest rates. However, all of these things only make sense when they are stuck in a consistent framework for the economy as a whole – which involves considering the factor shares of both inputs and income in the economy. Without this constraint, the entire issue can be hard to pin down and understand!
NZIER recently analysed the issue of an aging population using an overlapping generations model of the New Zealand economy.2 This type of model is a good way to approach the issue of population aging, and helps to capture changes in the way people decide to save and how long people are willing to work before really retiring.
The model shows that, among other things, real wages rise and the amount of capital per worker also lifts. NZIER discusses this outcome in terms of a “shortage” of workers which leads to firms bidding up wages.
At the moment when we talk about skill shortages, we are normally concentrating on specific types of occupations, where the increases in the types of skills in the labour market haven’t kept up with rising demand for that type of worker.
However, the increase in wages experienced due to the changing age distribution of the population is not the result of a shortage of a particular skill. In fact, the term “labour shortage” becomes slightly inappropriate here. Instead, the lift in wages is because we are in a situation where there are now more tools (capital) for each worker.
With only a slow increase in the number of workers, relatively unchanged (or higher) average savings rates, and slower population growth, rising capital accumulation is a natural consequence.
This outcome may sound strange at first, but there is a way to explain it that appeals to a natural way of considering how we may make choices.
An individual will decide to save on the basis of what they think they’ll need in the future, and what they want to provide for the next generation. This saving is then lent out to fund investment, which goes into capital. This saving behaviour will be influenced over the next 50 years in two ways.
Firstly, with individuals living for longer, they will need to save and invest more during their working lives in order to pay for their retirement. As a result, longer lifetimes will lead to an increase in savings rates out of earned income.
Furthermore, if population growth slowed and income earners still have the incentive to save the same fixed proportion of current earned income, it can be shown that this leads to a process that drives up the amount of capital per worker.
However, there is always a price involved somewhere – as the amount of capital per person rises, the return per unit of capital (and/or the interest rate used in lending markets) will fall. This shift will reduce the amount people are willing to save and invest, but it isn’t estimated to be enough to stop capital per person rising.
With more capital per person, and capital owners accepting a lower rate of return, relative wages would be higher. In essence, slower population growth is, over the long term, expected to lead to capital deepening.
An example of a country where this has already played out is Japan. The “labour crunch”3 in Japan has been two-fold – with an aging population and a broad exclusion of women from large sections of the labour market.
After a prolonged period of subsidising failing firms (either directly or through the banking system), the government is now more willing to let adjustment take hold. As a result, labour force participation by women is rising, contracts are being made increasingly flexible, and the utilisation of labour-saving capital investment (robots) is becoming more elevated.4
Savings, asset prices, and interest rates
This section covers changes in savings, asset prices, and interest rates stemming from an aging population, longer lives, and lower fertility.
Summary points
- In the long-term, lower fertility rates and longer lives will lead to move saving during people’s income-earning years, driving down interest rates.
- In the short term, the effect of the retirement of baby boomers on interest rates is less clear.
- However, there is significant downside risk to asset prices – as we have already seen in Japan and Germany as their populations have aged.
In the longer term, the older population and longer lives will ensure that real interest rates fall.
As discussed above, slower population growth is expected to drive up the ratio of capital to labour, implying that the extra return on a unit of capital equipment will be lower. Furthermore, income earners are now saving for a significantly longer retirement, implying that they will want to save a larger proportion of current income.
However, in the short term, the level of dissaving by those that have retired, the transfer associated with national superannuation payments, and a relatively smaller cohort of workers funding this retired generation will have a more uncertain effect on interest rates.
The first stage in this process is when people who are retiring stop saving and start dissaving – thereby pulling out of purchasing assets and trying to sell them. The corresponding drop in rates of both savings and investment could initially drive up or down real interest rates (depending on its effect on planned investment in the economy, and whether retirees are more aiming to keep assets for their children or dis-save for their own consumption). However, it will drive a decline in asset prices.
In New Zealand, this bears a particular risk to house prices, given that housing is an asset class that has been used strongly for retirement purposes by households.
Graph 5.20
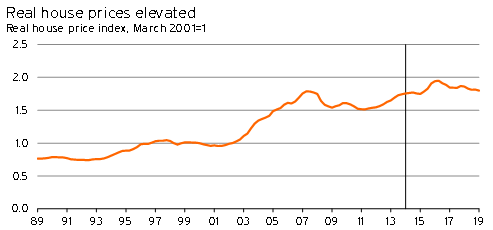
The decline in real house prices, and broader asset prices, in Japan and Germany during the early 1990s was due to a large number of factors (eg asset bubbles, German reunification). However, both countries also experienced much earlier population aging than New Zealand.
The US Federal Reserve has also analysed movements in residential property prices with respect to America’s aging population.5 The Fed’s simulations suggest that part of the current drop in US house prices could be the result of population aging.
Given that the New Zealand population is slightly younger, this framework suggests that there is some downside risk for asset prices during the next ten years.
Furthermore, the aging population will also have a significant effect on the types of goods and services demanded by New Zealand consumers. This is an issue we intend to look into in an article later in the year.
Superannuation, health, and fiscal sustainability
This section covers the outlook for spending on older dependents over the next 50 years – specifically rising expenditure on national superannuation and healthcare costs.
Summary points
- Although superannuation costs rise over the next five years, the lift is manageable. The large increases occur later on.
- Healthcare spending has been surprisingly restrained. However, rising healthcare spending in the long run is likely to be a bigger issue for fiscal sustainability than superannuation costs.
- Both superannuation and health care spending will place significant strain on the government’s budget – increasing required spending by government by as much as 14% of annual national income!
Another area where the aging population will have an effect is on the government’s books.
The sustainability of national superannuation and rising health care costs are two issues that have received a lot of attention for a prolonged period of time. However, since the retirement age was increased to 65, there has not been any significant policy change.
Given we are premising our forecasts on another term for National in government, we do not expect a significant change in retirement policies.
Superannuation
New Zealand superannuation is not means tested or conditional on income earned (except for non-qualifying spouses). Therefore it essentially offers people over the age of 65 a guaranteed minimum income paid for by the taxpayer.
With the proportion of the population over the age of 65 now climbing, superannuation payments will rise persistently.
Graph 5.21
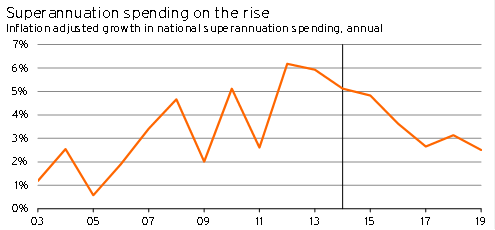
Over the next five years, the lift in superannuation payments (adjusting for inflation) is expected to be manageable – growing at a slower rate than it has over the past six years. However, the fiscal burden will start to pick up – approximately doubling as a share of national income by 2060.
In an environment where means testing or income testing is not introduced for superannuation, the retirement age is left unchanged, and eligibility and funding rules are left unchanged, superannuation payments are expected to be equivalent to between 8.0% and 9.2% of GDP by 2060. This proportion compares to a cost of 4.4% of GDP in 2010.
Is spending on health sustainable?
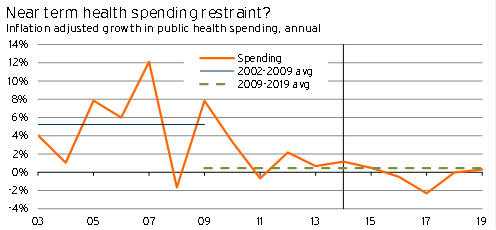
Outside of early life, the vast majority of health care spending occurs during old age.6 With a growing proportion of the population moving into old age, and significant public funding of healthcare, this is a growing burden for taxpayers.
In the long term, growth in spending on healthcare is expected to heavily outstrip growth in incomes, with public health spending as a percentage of GDP expected to rise to between 11% and 13%.7 This increase is a massive lift from current spending, which represents 6.5% of annual GDP.
However, the upward march of health care costs is not necessarily a given. In a recent interview for Vox.com, former director of the Congressional Budget Office Peter Orszag suggested that there has been a significant, and unexpected, shift in the trend lift of healthcare expenditure in the United States.8
Although this trend in the US is encouraging, the same drivers of falling real health care costs in the US are unlikely to have as strong an effect in New Zealand. US healthcare has long been notoriously expensive and, as a result, improvements in organisation and administration are likely to have a much larger effect on costs there in the long term.
Overall, improved administration and cost management are assumed in our current forecasts. If the economic recovery leads to an escalation in cost pressures in the health sector, it would place greater pressure on government finances than we have currently allowed for over the next five years.
Furthermore, our estimates for healthcare spending exclude currently unallocated spending increases, some of which are very likely to be allocated to health over the next five years. As a result, our forecast represents a minimum expected level of spending in the medium term.
Graph 5.22
Two areas that have contributed to cost inflation in the health sector have been wage bills and technological growth. On the technology side, the costs of new, expensive, technology available to extend and improve people’s quality of life have risen. This trend is very different to what has happened to technology costs in all other sectors, where technology has been used to provide the same or improved service at a lower and lower cost.
With rapid increases in robotics, 3-D printing, and distance surgery, there is a rising chance that the sharp downward pressure on capital costs (and wage bills) associated with investment in other sectors may soon show up in the health sector.
Such an adjustment would be game changing, and could help to make the fiscal situation more sustainable. However, at present there is little evidence that these technological advances will have a significant effect on health care costs during the next five years.
1 www.calculatedriskblog.com/2014/04/reasons-for-decline-in-prime-age-labor.html
2 www.nzier.org.nz/sites/nzier.org.nz/files/NZIER%20Insight%2037%20-%20%20demographic%20change.pdf and www.nzier.org.nz/sites/nzier.org.nz/files/NZIER%20working%20paper%202013-01%2C%20Golden%20years.pdf
3 www.ajw.asahi.com/article/business/AJ201406050014
4 2009 figures www.swiss-miss.com/2009/01/top-10-countries-by-robot-density.html; 2012 estimates www.twitter.com/davidmwessel/status/476323391650009088
5 www.federalreserve.gov/pubs/ifdp/2005/847/ifdp847.pdf
6 www.treasury.govt.nz/government/longterm/externalpanel/pdfs/ltfep-s1-02.pdf
7 www.fsc.org.nz/site/fsc/files/reports/LTFMScenarios4c2013.pdf
8 www.vox.com/2014/6/15/5807046/orszag-its-time-for-some-optimism-about-health-care-spending