Lies, damn lies, and statistics
The collection and analysis of statistics shapes our understanding about much of the world. It is vital for social sciences such as economics, but it has also been important in pushing advances in physical science fields such as biology, geology, climatology, and medicine. A key aspect about statistical analysis is an ability to generalise evidence collected from a relatively small sample into inferences about conditions throughout the whole population. Thus pollsters can collect opinions from a small proportion of the national population and, with a reasonable amount of confidence, make pronouncements about people’s preferences about things such as political parties, consumption, and social issues.
The power of statistical inference is demonstrated by the way that election nights under MMP are no longer the television spectacle that they used to be in the first past the post electorate system. Prior to MMP, uncertainty about the election result could last deep into the night. Under MMP, the primacy of the party vote means that the general result is often pretty clear even when just 1 or 2% of the vote has been counted. The rest of the broadcast can become as enthralling as watching paint dry. The party votes might climb or fall a bit as the night proceeds, but there is little change in the big picture: the party leading early in the evening will still be leading at the end of the evening and no miracle will save the party vote for a party on 1%.
Although this perhaps wrecks the night for political junkies, it must make statisticians feel comfortable and reassured that statistical properties continue to hold. However, despite the great informational power of statistics, bear in mind that sample based statistics are still always measured with error. How often do we hear news items that note something like: ‘according to the latest political poll, the support for the Haveigotadealforyou Party has increased from 9% to 9.5%” etc, but then just before closing the item they state that the survey has a 2% margin of error. If you are awake to this point you suddenly realise that you have just been totally misled. With an error margin of 2 percentage points, you cannot make any inference about anything within a 2 percentage point margin. There is no statistical evidence that the support for Party has changed since the last survey when it received 9% support. One can only say that the Party’s support is higher than parties ranking less than 7.5% and below those that rank above 11.5%.
We should not be too hard on the media about this as even Statistics New Zealand can appear to infer too much from their own statistics. In the release of the June 2013 quarter Household Labour Force Survey, Statistics New Zealand stated among other things in their “key facts” that the number of people employed increased by 8,000. Yet, if you bothered reading as far as page 14 of their release, one would discover an interesting statement: the estimated total number of people employed … is subject to a sampling error of plus or minus 26,500.
The key fact is not that the number of people increased by 8,000, but that there is no statistical evidence of a change in employment numbers. But that sounds a bit wishy-washy doesn’t it? And it does not sound as authoritative as stating a precise number.
Our hunger for fresh news encourages the reporting of changes when there is actually no evidence of a change. By trying to get the media friendly sound-bite, Statistics New Zealand presents a false sense of accuracy and as a result contributes to a spread of misinformation. The labour market is reported to be improving, when it may not have, and then the following quarter a deterioration is reported. The true story, based on statistical inference, is of little change, but instead we are fed an impression of volatility. In reality what we have is a survey that lacks the statistical power to provide much information about quarter to quarter changes in the New Zealand labour market.
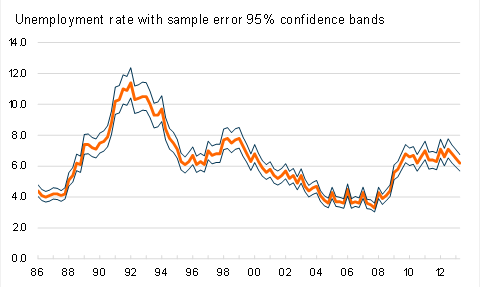
In the attached graph, I present the New Zealand unemployment rate as measured by the Household Labour Force Survey since 1986 along with my estimates of the 95% confidence bands for this measure based on sampling errors reported on page 14 of the June quarter 2013 survey release. Effectively, one cannot infer that there has been a material change in the New Zealand unemployment rate since 2009. We have some confidence in saying that unemployment today is higher than what prevailed throughout most of the first decade of the century. It also seems clear that the unemployment rate has been above 6% since 2009, but it is less clear whether unemployment today is higher or lower than it was in 2010 or 2011.
One can react to this article in (at least) two ways: one could become a bit more relaxed about the significance of changes reported in statistics or one could seek improvements to the accuracy of statistical collection. Does it really matter if the unemployment rate is 6.5% or 6.0%? Both are reasonably high and indicate tough conditions for those seeking employment. However, if the measured unemployment rate falls from 6.5% to 6.0%, we would prefer to know that this represents an actual fall and a sign that prospects are improving. Market commentators and forecasters can provide some insights into the significance of new data but ultimately we are constantly in the position of having to wait for more information before being able to assess the information contained in a survey release. This brings us to the heart of a key difference between weather forecasters and economic forecasters: weather forecasters at least know what the weather conditions are today.
Improvements in the accuracy of official statistics can come from two (not necessarily mutually exclusive) approaches: providing more resources to statistical collection and being smarter about how the data is collected. One way of improving the accuracy of the Household Labour Force Survey would be to extend the size of the sample. A larger sample will decrease sampling error, and therefore reduce the amount of “noise” generated by survey results. The accuracy of the survey could also be improved by reducing the number of proxy responses (i.e. the number of times that other household members respond on behalf of absent members). Both of these approaches would cost money, and thus require society to make trade-offs, as devoting more resources to data collection will reduce resources that could be used elsewhere.
Increased computing power has meant that more use can be made of “big” data. Administrative databases are now an important component of the New Zealand statistical framework. In earlier times it would have been impractical to process the population-wide data that is now at the disposal of statistical agencies. Although large administrative databases bring their own challenges (eg privacy and adapting data collected for one purpose for another) a key beauty is that population-based data makes sampling issues trivial and means that one can investigate subcomponents more accurately.


