What does New Zealand’s international liability position look like?
It has long been accepted as fact that New Zealand is an outlier in terms of its large stock of global liabilities and that this position is a big risk for the economy. However, after four years of near constant revisions to the data, does this belief still hold up to scrutiny?
Current account deficits: a flow of borrowing
New Zealand’s current account deficit has been noted as a cause for concern for several decades now. Previously we have pointed out that we need to ask why New Zealanders are borrowing to decide whether it is a concern or not1, but when the current account deficit hit 9% of GDP (when we would expect nominal GDP, on average, to grow at about 5%pa) the fear of a sudden stop in foreign lending to New Zealand was understandable.
Adding to these fears was work by Reinhart and Rogoff2, which publicised the fact that New Zealand held a large amount of debt relative to other countries, both in gross and net terms. Furthermore, work published by the Reserve Bank in 2010 also pointed out how significant New Zealand’s liabilities relative to income were3.
However, since that work was done (based on 2009 data), revisions by Statistics NZ have led to a significant change in New Zealand’s reported current account deficit and liability position.
There were two key areas where activity related to the current account was known to be underestimated: service exports and goods imports. Service exports were understated due to a lack of coverage for spending by tourists and international students. Goods imports were understated due to a lack of survey coverage on imports valued at under $1,000 (primarily purchased through online shopping).
Graph 5.10
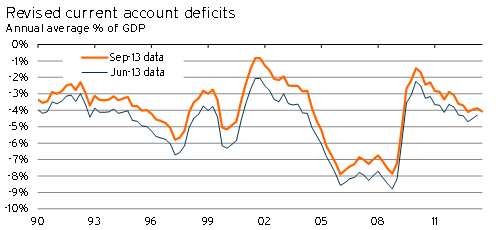
Given that higher services exports would shrink the deficit, and higher goods imports would lower the deficit, it was not immediately clear whether this mismeasurement would have much of an effect on the overall current account deficit.
According to Statistics NZ, the underestimation in service exports was (and still is) significantly larger than the underestimation in goods imports. As a result, new historical estimates for the current account deficit are significantly lower than they had been for the past 20 or more years. Nevertheless, this gap has been shrinking through time as internet retailing has gained more and more market share.
Although these revisions were significant, two of the key trends remained unchanged. The current account remained in deficit over the past 25 years, and 2005-2008 was still a period with significant deficits – in the range of 7-8% of GDP.
What about the stock of debt?
However, when discussing the risks around debt it is not the current account deficit that is of prime importance – it is the net and gross stock of liabilities that matters.
The latest revisions did not change the estimated gross or net stock of liabilities held in New Zealand. Instead, they merely helped to explain part of the gap between the current account data and the net international investment position data.
However, compared to the data published by Reinhart and Rogoff, there have been significant revisions to New Zealand’s net liability data. Most of these revisions took place during 2009, although there were also significant revisions on a quarterly basis following the Canterbury earthquake (as Statistics NZ tried to estimate, and work out how to incorporate, the flow of reinsurance money).
So what story do these revisions tell?4
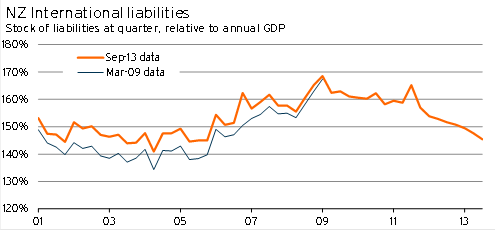
Graph 5.11

The most significant revision was on the estimated international asset side of the equation. Statistics NZ ran through the key drivers of the revisions in their June 2009 balance of payments release5.
- A reconciliation between the Quarterly International Investment Survey (QIIS), which is used for the net international investment position data, and published company reports
- Changes in the classification of types of assets and liabilities (although these changes did not affect the totals we are discussing)
- Extension and improvement of data reporting
- Use of the Annual International Investment Survey to improve estimates of areas not covered by the QIIS
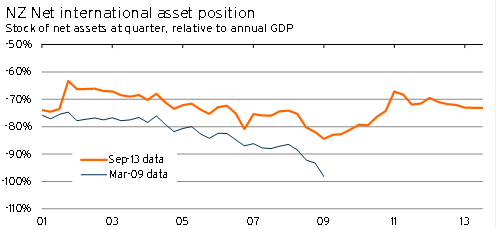
Graph 5.12
Graph 5.13
These revisions saw gross liabilities and assets get revised up. However, as the upward revision in the asset position was larger than the revision in the liability position, net liabilities were reduced.
This begs the question, in what ways do we care about net and gross liabilities separately?
- The key worry with net liabilities is the ability to fund future consumption and investment. The higher a country’s net debt position, the greater the amount of production that has to be used for interest and dividend payments rather than for consuming or investing.
- Our main concern with gross liabilities is what happens if our creditors suddenly want payment, or simply become unwilling to roll over debt. This concern is the fear of a sudden stop.
In terms of net debt, the revisions have led to a significant improvement in New Zealand’s position. At current levels, the size of New Zealand’s net debt position is sustainable. But given the payments on debt, it also means that New Zealand can be expected to continue running current account deficits the foreseeable future.
The Treasury has also noted that New Zealand’s net liability situation can be exaggerated due to a number of other issues, such as the treatment of inflation6.
When we consider gross liabilities, there are two key risks.
- A sudden stop and the inability to roll-over debt
- A sudden drop in the dollar, and a corresponding lift in the real value of debt
Both of these issues have led to rising Reserve Bank regulation, with the introduction of policies regarding mismatch ratios and core funding ratios.
The Reserve Bank provides balance sheet information on banks. Given that banks hold the vast majority of New Zealand’s foreign liabilities (as an intermediary), this information allows us to have a look at the vulnerability of the debt position. The proportion of bank liabilities that are directly tied to foreign currency funding (from both domestic and foreign residents)7 was consistently between 30% and 34% from 2004 to 2011. However, this figure began falling sharply in late-2011 and by the end of 2013 was 26%. This result is surprising given the high value of the New Zealand dollar, as it implies that people lending to the banks are taking on an increasing amount of the current risk as the dollar has risen.
Furthermore, prior to the global financial crisis over 90% of banks’ foreign-currency denominated liabilities to non-residents matured within 90 days. By 2013, this figure had declined to 56%8.
As a result, the riskiness of the current gross liability position has eased since the Global Financial Crisis.
When comparing the liabilities of a small open economy to larger economies there is another important point to keep in mind, namely that the liabilities of foreign-owned firms to their parent companies are counted as part of total New Zealand liabilities!
Further detailed discussion of New Zealand’s net liability position has been put together by the New Zealand Initiative9. Although we do not necessarily agree with the conclusions they take from the data, the factual information provided is very useful for those interested.
New Zealand and Australia
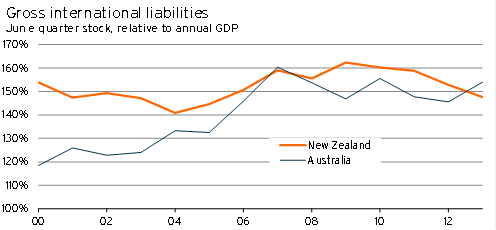
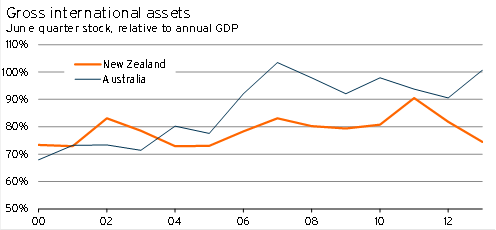
One comparison people like to make is between gross liabilities in New Zealand and gross liabilities in Australia. It is commonly stated that New Zealanders hold, relative to GDP, greater external liabilities10. Although this statement was true at the turn of the century, in terms of gross liabilities it does not seem to be the case anymore (see Graph 5.14).
However, Graph 5.14 doesn’t show the entire story. Although gross external liabilities are very similar, relative to national income Australia has a much larger stock of gross external assets.
Graph 5.14
Graph 5.15
Graph 5.16
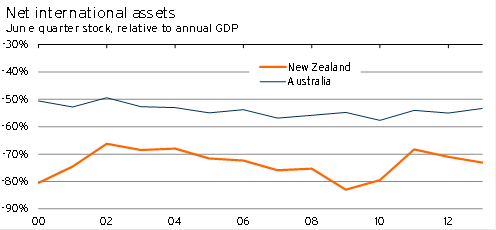
As a result, Australia’s net liability position relative to national income is smaller than New Zealand’s.
Australasia and the world
Although our position isn’t too different from Australia’s, this merely begs the question of how the Australasian liability position compares to the rest of the world.
It is difficult to compare national gross liability positions between countries – the CIA World Factbook has comparable debt figures, but not total liability positions11. Furthermore, we cannot be sure the Reinhart and Rogoff figures will be reliable anymore12. For example, we know that New Zealand (and to a lesser extent Australia) has experienced significant revisions to its data in recent years.
As a result, we will focus on the net liability position, which tends to be more openly reported.
Eurostat reports the net liability position of a range of European countries as a percentage of that country’s GDP13. We compare these countries with New Zealand and Australia in Graph 5.17, Graph 5.18, Graph 5.19, and Graph 5.20.
Graph 5.17
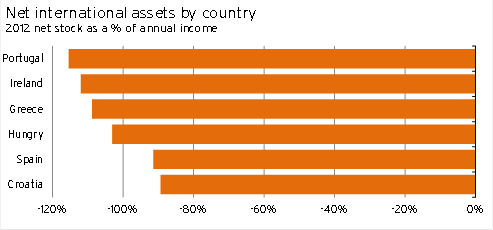
Graph 5.18
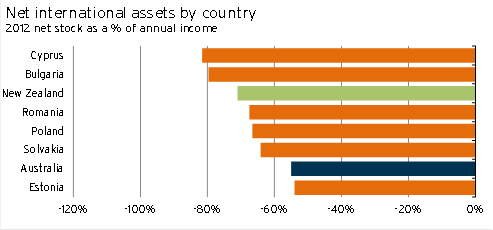
Graph 5.19
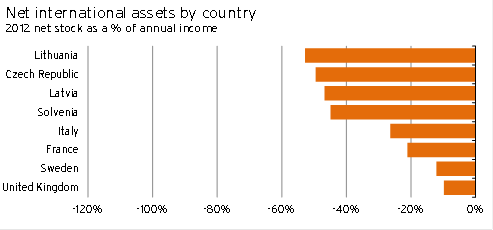
Graph 5.20
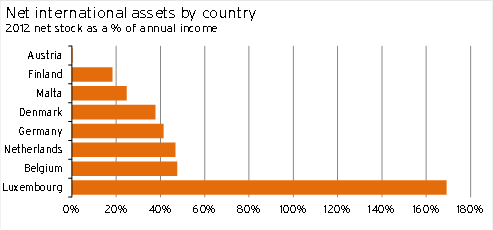
In this context New Zealand and Australia appear fairly indebted in net terms, placing us on a comparable footing with many Eastern European countries – but still significantly better than the crisis countries such as Portugal, Ireland, Greece, and Spain. Both Australia’s and New Zealand’s net liability positions looks high compared to Italy – but the crisis in Italy is not about the net debt position, but the significant amount of Italian government debt.
However, it is important not to read too much into this – our gross liabilities are significantly lower than countries such as Ireland and the United Kingdom (where gross debt tends to be around 1,000% and 400% of GDP respectively).
Furthermore, the vulnerability of European countries to a bank run is a lot higher than New Zealand and Australia, given that the Australasian countries have their own currencies that would depreciate and reduce the value of debt in the event of a crisis. In contrast, European nations are trapped in a currency union, which is effectively a fixed exchange rate regime.
1 https://infometrics.co.nz/Forecasting/4803/901/New-Zealand-Inc%27s-borrowing-addiction
2 http://scholar.harvard.edu/files/rogoff/files/growth_in_time_debt_aer.pdf
3 www.rbnz.govt.nz/research_and_publications/reserve_bank_bulletin/2010/2010dec73_4Steenkamp.
pdf
4 The lift in assets in 2011 in Graph 5.11, and subsequent fall, was due to insurance pay-outs related to the Canterbury earthquakes being included as foreign assets until they were paid through.
5 http://stats.govt.nz/browse_for_stats/economic_indicators/balance_of_payments/
BalanceOfPayments_HOTPJun09qtr.aspx
6 www.treasury.govt.nz/publications/research-policy/wp/2013/13-04/
7 www.rbnz.govt.nz/statistics/tables/s1/
8 www.rbnz.govt.nz/statistics/tables/s2/
9 http://nzinitiative.org.nz/site/nzinitiative/files/publications/global%20links.pdf
10 http://macroexposure.com/wp-content/uploads/2014/02/AvsNZ.png
11 www.cia.gov/library/publications/the-world-factbook/
12 Note that this is not a comment about the quality of the work, and is unrelated to the concerns about their analysis of austerity (see http://economics.about.com/od/Economic-Growth/a/The-Reinhart-rogoff-Austerity-Controversy.htm).
13 http://epp.eurostat.ec.europa.eu/tgm/table.do?tab=table&plugin=0&language=en&pcode=tipsii10


