Chart of The Month: Doing the numbers on infrastructure
Infrastructure spending around New Zealand is a hot topic. Our Chart of the Month for August details our understanding of infrastructure spending across New Zealand and what is being spent where.
On Friday, Infrastructure Minister Shane Jones announced that a new government agency will be established to drive infrastructure growth across New Zealand.
In his announcement, Minister Jones noted "we've struggled to get a clear picture from officials of its [infrastructure] scale, when it would hit us the worst and in which sectors… Treasury is currently unable to properly quantify the value of the deficit we're facing – it doesn't hold accurate or up-to-date information about all infrastructure projects across all sectors and advises that agencies themselves may not necessarily know the extent of their future capital needs.”
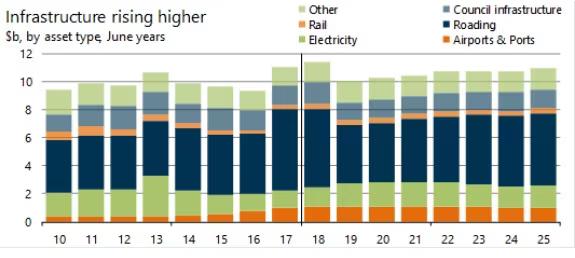
Here at Infometrics, we’ve got quite a good handle on what Infrastructure projects are coming up, and where the money is likely to be spent – nationally and at a regional level. Our Infrastructure Pipeline Profile (IPP) tracks major infrastructure areas to help businesses understand where investments will be made, and what work might be coming up. Our current IPP figures suggest that infrastructure spending will average $10.6b over the eight years to 2025, with roading capturing 45% of this total spend.
We are currently undertaking a comprehensive update of our IPP to extend our coverage until 2028. This will be available by late-September 2018. In the meantime, we’ll await a call from Minister Jones…
Find out more about our Infrastructure Pipeline Profile here.