The challenge of predicting regional population growth
Local councils are once again putting their thoughts towards their Long Term (10-year) Plans which need to be completed next year. Fundamental to their plans are reliable metrics on the size of their current and future population.
Council’s frequently rely on the sub-national population projections presented by Statistics New Zealand (StatsNZ). The delay of the census has meant that StatsNZ will not be able to update their sub-national projections until the second half of next year. The lack of updated projections leaves councils needing to rely on the outdated StatsNZ sub-national projections which use 2013 census numbers as a base.
Not only are the StatsNZ sub-national projections outdated, but they have other shortcomings for councils. In this article I argue that private agencies with an understanding of local economies are better placed than StatsNZ to stick their necks out and provide population projections that are fit for council’s purposes.
Predicting national-level population requires a good handle on migration trends
To make meaningful sub-national projections, StatsNZ first need to make national level projections. Population growth in the national economy is the outcome of births, deaths, and international net migration. Net migration is the component of population growth which varies the most, has the biggest impact on population growth, and is where projections usually go wrong.
StatsNZ’s population projections are presented as a range of scenarios which include assumptions about each of the components of population growth, including net migration. StatsNZ scenarios are not supposed to be judgements on expected outcomes, but rather plausible scenarios. But here’s the rub: StatsNZ’s middle-of-the-road or ‘medium’ scenario tends to be used by policy makers as the most likely scenario, but it tends to be very conservative. For example, the medium scenario assumes net migration of 15,000 per annum over the 30-year forecast period, yet it has averaged more than 60,000 per annum over the past five years. Despite government promises of bringing down migration it is still sitting above 50,000 currently.
Councils plan better for the future by using population projections that are based on a substantiated view of international net migration rather than just a scenario, especially a conservative scenario. Unlike StatsNZ, independent organisations are at liberty to stick their necks out and make a call on the likely net migration level in the future. This requires a considered view of the many factors affecting migration, including policy directions and the relative strength of New Zealand’s and other international economies, especially Australia.
Sub-national projections need to consider economic drivers of regions
In the next step of the projection process, national-level projections need to be broken down to a sub-national level. StatsNZ put a lot of work into these projections looking at historical trends in net migration, planning decisions by councils, and the desirability of a region for new migrants. However, a fundamental problem with their approach is that they do not explicitly consider the future economic prospects of the industries that make up a region’s economy.
Economic performance is a key contributor to population growth as New Zealanders are highly mobile and move to where jobs are located. A region that performs well economically and creates jobs will attract workers and its population will grow.
Southland is an example of a region where economic prospects have turned its demographic trends around. The region’s economy struggled for several decades and its population appeared to be in terminal decline. StatsNZ predicted that its population would not only continue declining, but that the decline would accelerate between each census up until 2021.
In 2008 Infometrics prepared population projections for Southland region which considered the region’s economic prospects. We recognised that the region’s economy had turned a corner due to good prospects for the dairy industry and that the region had potential to grow again. Our baseline scenario of economic and population growth predicted modest population growth of 0.4% per annum between 2006 and the next census in 2011, compared with StatsNZ’s estimate of a decline of 0.2% per annum. As it turned out the census was delayed by two years, but the results of the 2013 census showed that Southland’s population had grown by 0.4% per annum over the seven-year intercensal period.
Comparison of projections of Southland region’s population prepared in 2008*
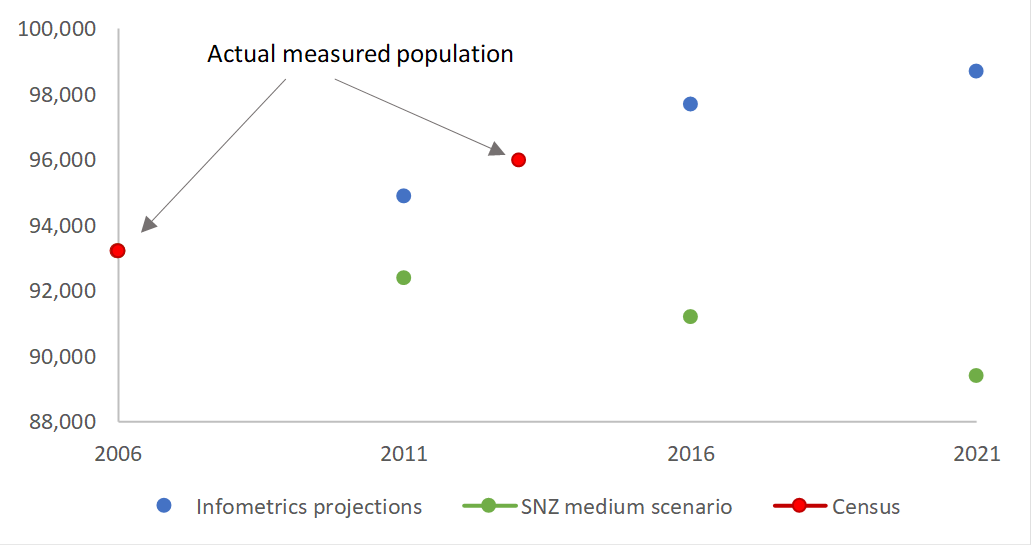
* Population projections prepared by StatsNZ and Infometrics use a slightly different definition of population to the usually resident population definition used in Census. In this article we have adjusted the population numbers used in the projections to be consistent with the census definition.
Population projections are a vital input to future plans for regions. They inform future expenditure on schools, health facilities and other infrastructure. But I question whether StatsNZ is well placed to make explicit judgement calls on all the economic, policy and social influences that determine population outcomes of individual regions. Private agencies, with an understanding of the outlook for regional economies, are better placed to stick their necks out and make calls on expected outcomes.