Insights from the 2018 Census (so far)
On 23 September StatsNZ released the first batch of Census 2018 data, which includes high-level national trends, population counts for local areas, and the number of electorates. Although it is great to finally have some 2018 Census data, the information available is still very high level.
We’ve dived into the data that is available and highlighted ten areas of interest, including some insights into just how quickly New Zealand has grown, how administrative data use varies across areas and how dwellings have grown relative to the population.
1. More workers putting in a full-time week
Census 2018 data shows that 42% of workers worked full-time (31-40 hours) in the week leading up to the Census, higher than the 40% in 2013. A further 30% – around 744,000 – spent more than 40 hours a week working in the week leading up to the Census, including 273 people who recorded working all 168 hours in a week! That’s every hour, of every day, of a 7-day week.
2. Half of local council areas had 10%+ admin data use
The 2018 Census was marred with a low response rate, with StatsNZ using administrative data, among other methods, to plug the gaps. Our analysis of StatsNZ’s admin data use shows that 37 local council areas had 10% or more of their population counted using admin data. Three districts – Ōpōtiki, Kawerau, and the Far North– had more than 20% of their population counted from admin sources.
3. Around 1 in 5 homes are damp
The much-anticipated housing quality measures showed that nearly 79% of private dwellings weren’t considered damp by those who lived in the dwelling. At the same time, just over a quarter of a million dwellings had mould which was sometimes or always larger than an A4 sized piece of paper.
4. Population grows fast, but not as fast as we thought
New Zealand’s population grew at the fastest rate in half a century, with 10.8% growth between the 2013 and 2018 Census. However, data from the Census on 5 March 2018 was 129,000 below StatsNZ’s estimated population satiates for 31 March 2018.
Regardless, the sheer strength of growth over the five years to 2018 was substantially higher than previous projections from StatsNZ, and with new projections not due until December 2020, it’s a struggle to plan for the future based on undershooting projections.
5. Fastest growth in our 65+ population
The 10.8% population growth over the five years to 2018 was fastest for the baby boomers (those aged 65+) which increased nearly 18% over the five-year period. The working age population (15-64) rose around 11%, while those aged under 15 notched up growth of just below 7%.
6. One new electorate
The population figures mean that New Zealand needs an additional electorate, which will be created in the North Island. Around a third of all boundaries will need to be adjusted to better represent New Zealand changing population.
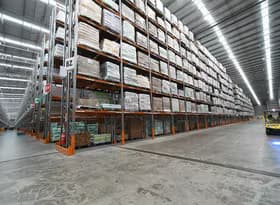
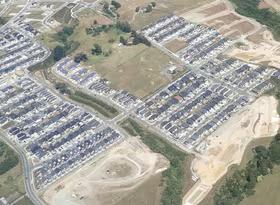
7. Housing pressures increase
Although the population grew substantially, the dwelling stock didn’t follow suit. Occupied dwelling numbers rose only 6.6% between the 2013 and 2018 Census, slower than the 10.8% population increase. Queenstown Lakes District had the largest percentage point difference, with the population growing 39% but dwellings only increasing by 23%.
Strong population growth in Northland also wasn’t met with the same growth in dwellings, with the Far North (2nd in NZ), Kaipara (5th) and Whāngārei (6th) districts all seeing some of the largest differences between population and dwelling growth.
8. Home ownerships rate slipped marginally
Over the five years between 2013 and 2018, there was a slight dip in home ownership rates. In 2018, 64.5% of all occupied private dwellings were owned or partly own by those living in the home, down 0.3 percentage points from 64.8% in 2013.
9. Religion in New Zealand declines further
Data from the 2018 Census shows that around half of the population (48%) has no religious affiliation, up from around 38% at the 2013 Census. Interestingly, we apparently have over 20,000 Jedi among our ranks.
10. Smoking rates decrease further
Smoking continues to fall out of fashion in New Zealand, with nearly 65% of New Zealanders having never smoked, up from 62% in the 2013 Census. In relative terms, the number of people smoking has declined to 13.2% of the 15+ population, although the actual number of smokers has increased by around 35,000.
What’s next with Census 2018?
We’re still waiting for more detailed data to become available before we can incorporate it into our range of products and undertake robust analysis. There are no firm timeframes for data delivery yet, but we’re hoping we will know before Christmas. Infometrics has been working closely with StatsNZ to understand the changes to the Census data and how the data has been created and continue to be in close communication with StatsNZ about getting access to detailed Census data as soon as possible.
However, the one area we do know a little more about is the timing for population insights – revised population estimates for local areas will be available at the end of March 2020, with new local area projections not coming out until December 2020. The wait for new insights continues…