Articles

The labour force participation rate has been consistently rising over the past 30 years in New Zealand, providing a welcome boost to the labour supply. But can participation keep rising? Read

Stats NZ released the first detailed tranche of 2023 Census data today, including detail on individuals and households down to a small area level. In this article, we share ten insights from the 2023 Census. Read

Economics consulting firm Infometrics is pleased to announce that Nick Brunsdon, Principal Economist and Lead Demographer, has been appointed to our board of directors. Read
Last week Stats NZ released the first tranche of data from the 2023 Census, an exciting milestone for anyone with a thirst for regional or socioeconomic data. With the prior Census held in 2018, this represents the first Census data since the start of the COVID-19 pandemic. In this article, we dive into the first tranche of data, explain why the good stuff is yet to come, and raise a note of caution for population comparisons with the first tranche of data. Read
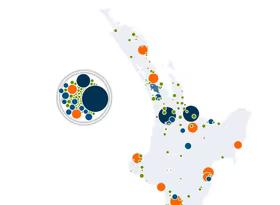
The two drivers for population growth - natural increase and net migration - are changing. Here, we explore the implications of short and long term demographic trends on population growth around the regions over the next ten years. Read

Budget 2022 was a milestone for the disabled community with the announcement that the Ministry for Disabled People would be established from 1 July. The Government is signalling that the new Ministry marks a move towards a ‘whole-of-life’ approach to disability, rather than viewing it as a ‘health’ issue. Read
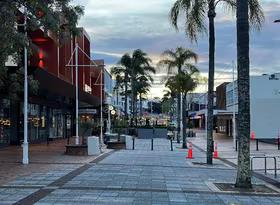
A fact that may surprise some New Zealanders is that their life is tracked and monitored by the government from the day they are born until the day they die. Read

The need to understand our changing population has been more important than ever, as an unexpected wave of migration rendered previous projections obsolete. This article explores how this migration wave changed our population, and our view of the future. Read
Back in August we noted that Auckland city (the urban area defined by Stats NZ) has as many people as the next 12 cities combined. We also showed a map dividing Auckland up into 12 areas with equivalent populations to the cities. Unfortunately, the map is now out of date as Stats NZ revised their population estimates in October. Read
Economic growth, inflation, and interest rates around the globe remain significantly lower than they were prior to the 2008 Global Financial Crisis. The limited success of efforts to stimulate the economy over the last 12 years are reminiscent of the Japanese economy’s stagnation during the 1990s. Are other developed economies, including New Zealand, at risk of suffering the same malaise as Japan over the medium-term? Read