Glut of mid-1990s used imports nearing scrap time
The New Zealand car fleet has aged rapidly over recent years, with cars in 2013 averaging 13.5 years of age, compared with 11.6 years of age a decade earlier. This article looks behind the issue by providing an overview of the age structure of the existing fleet and shows that the key contributor to the fleet’s aging is a glut of used imports manufactured in the mid-1990s.
Whenever we forecast car sales at Infometrics, we take a two-pronged approach to establishing our view of the outlook. Firstly, we model a likely demand scenario over the short to medium term, based on factors such as employment conditions, economic growth, interest rates, and the exchange rate (which affects car prices).
We then take the numbers from this first stage and crosscheck them against a model that looks at more fundamental drivers. This second model of fundamental drivers is based on issues such as car ownership rates, household formation rates, and vehicle replacement demand1. We could spend all day discussing these issues, but for the remainder of this article, let’s just focus on one key aspect of replacement demand – the underlying age structure of the New Zealand car fleet.
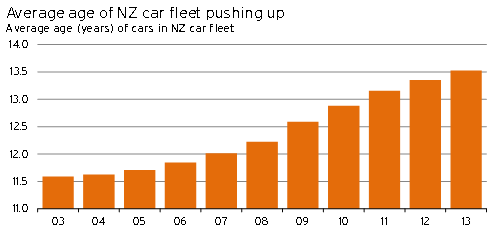
The Ministry of Transport’s Annual Fleet Statistics provides a great starting point for exploring changes in the New Zealand vehicle fleet through time. The statistics provide quantitative evidence of what we all see on New Zealand roads – the average age of cars in the fleet is rising. According to the Ministry, the average age of passenger cars was 11.6 years in 2003, but by 2013 this average age had risen to 13.5 years. This trend is clearly evident in Graph 5.1.
Graph 5.1
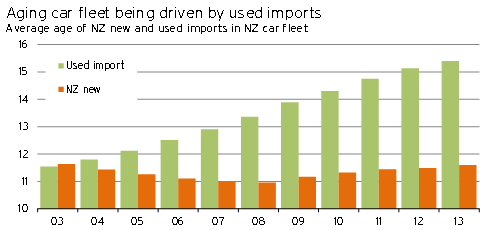
A closer examination of the data shows that New Zealand’s aging car fleet is explained by sharp increases to the average age of used imports in the fleet. In 2003, the average age of used imports on our roads was 11.5 years, while by 2013 the typical used import was 15.4 years old. By comparison, the average age of New Zealand new cars was steady at around 11.6 years over the same period. These trends are summarised in Graph 5.2.
Graph 5.2
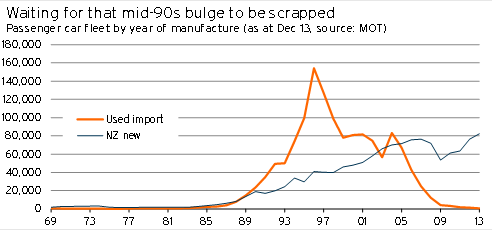
To get behind the issue of why the used import fleet’s average age has risen so rapidly, it is best to look at the underlying age structure of the fleet by year of manufacture. Graph 5.3 shows that there is a glut of used imports on New Zealand’s roads that were manufactured in the mid-1990s. An incredible 5.7% of all vehicles on our roads (one out of every 18) is a used import that was manufactured in 1996, while used imports manufactured between 1995-1999 represent around 21% (557,000 cars) of all vehicles in the New Zealand car fleet.
Graph 5.3
Of course, each year the glut of mid-1990s used imports is getting older, pushing up the average age of cars on our roads. But this trend can’t continue forever, as all cars eventually reach the end of their useful economic life and must be scrapped. Even so, data from the Ministry of Transport shows that the average age at which light vehicles were scrapped from the fleet in 2013 was 19.9 years, up from 18.0 years of age a decade earlier.
The key reasons for a rising scrap age over recent years has been a combination of economic uncertainty (and less job security) since the Global Financial Crisis, constraining willingness to replace old vehicles, coupled with technological advances to cars. For example, rust prevention technology in the early 1990s has extended the life expectancy of cars.
Our central view is that the average age at which vehicles are scrapped will stabilise over the next three years as brighter labour market prospects offset further technological advances. But even if our view proves to be wrong and the average scrap age increases to 22 years by the time we reach 2017, this won’t have hide the fact all used imports manufactured between 1995 and 1999 will have at least surpassed this milestone by that stage. And as these cars are likely be owned by those less willing (or unable) to have large amounts of wealth tied up in car ownership, the majority will be replaced by affordable used imports rather than new alternatives.
Ministry of Transport statistics shows that annual scrap rates for vehicles manufactured between 1995 and 1999 averaged just 4.4% in 2013, while scrap rates for vehicles aged four years older than that averaged just over 14%. To put these figures in perspective, if scrap rates for used imports manufactured between 1995 and 1999 rise to 14% over the four years to 2017, then the replacement demand they generate alone will account for half of our 120,000pa forecast for used import demand by that time. As a result, replacement demand from this mid-1990s glut will be a key element driving vehicle demand over the forecast horizon, no matter what happens to average scrap ages.
1 An overview of this fundamental approach to modelling car demand can be found at www.infometrics.co.nz/Forecasting/ForecastArticle.aspx?id=47.


