Trying to get to the bottom of housing affordability
Housing affordability is back in the spotlight as house prices, at least in Auckland, surge to record high levels. However, the issue of affordability is much more complex than meets the eye. This article examines the current spike in prices on a regional basis and compares the housing market’s pick-up with previous booms. The political response from both National and Labour is covered, before we embark on more in-depth examination of Auckland’s affordability issues. High land prices appear to be a major factor in driving up the cost of housing, while there are also question marks about the supply and demand of smaller and more intensive housing options. Building costs appear to be a relatively minor factor in the affordability equation. This article also queries the importance of home ownership as an end in itself, particularly when renting remains a relatively affordable accommodation option.
Breaking down the housing market’s current performance by region
The housing market has attracted increasing attention from media and politicians over the last year as nationwide house prices have climbed above their previous record high from 2007 (in nominal terms). But as we’ve repeatedly said over recent months, the nationwide figures mask a wide variance in regional trends and, if anything, overstate just how strong the market really is.
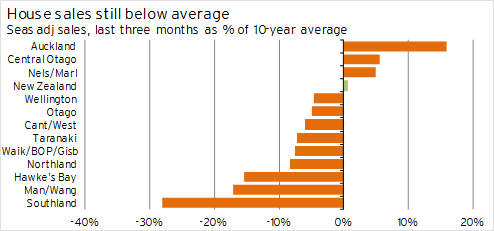
Firstly, let’s do a stock-take of regional housing indicators to put the current housing “boom” in perspective. Graph 1.1 shows the latest quarter’s house sales volumes as a proportion of average activity over the last decade. This graph shows that the lift in sales over the last four years has been largely concentrated in Auckland, and it has come off such a low base that activity levels around most of the country are still short of their average over the last ten years.
Graph 1.1
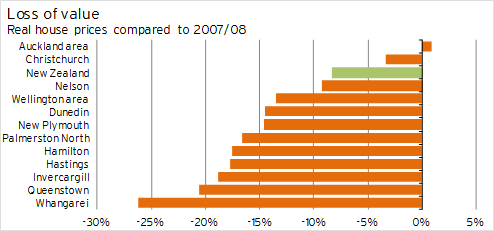
Graph 1.2 shows real house prices compared to their peak levels in 2007/08. Note that this data, utilising Quotable Value’s house price indices, only shows the largest urban area in each region. Property values in provincial and rural areas have generally fallen even further in real terms from their peaks. The median nationwide decline in real property values has been 20%, with Wairoa the worst-performing area with a 48% fall. Only in the Auckland urban area have real house prices recovered to their 2007/08 level.
Graph 1.2
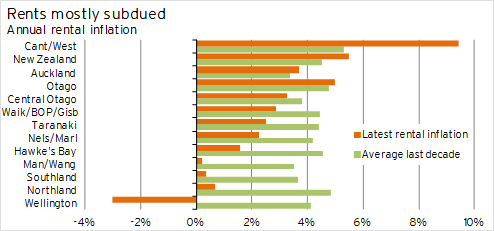
Graph 1.3 shows current rental growth around the country with the average growth in rents over the last decade. Only Canterbury/Westland is recording significantly above-average growth in rents at the moment as a result of the accommodation shortage caused by the earthquakes. Even in the Auckland market, which has shown signs of a supply shortage over the last two years, rental growth is only slightly above average.
Graph 1.3
The message from these graphs is clear. Any media or politicians talking about a housing “boom”, “bubble”, or “crisis” are exaggerating the issue. Any strength in the housing market is concentrated largely in Auckland and Canterbury, while most other regions are stable at best. As a result, we would expect housing affordability to be most under pressure in Auckland and Canterbury as well.
Affordability on a regional basis
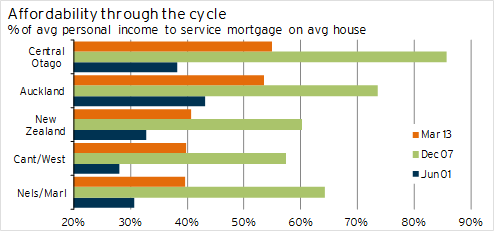
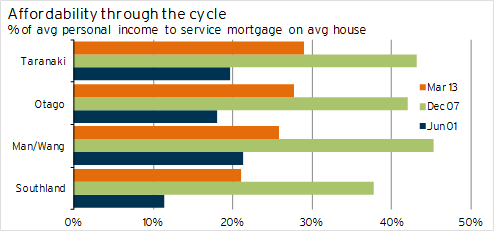
Graph 1.4, Graph 1.5, and Graph 1.6 show our favoured measure of housing affordability across different regions, comparing servicing costs for a mortgage on an average house with average incomes around different parts of the country. The graphs show the proportion of income that a person would have to spend on servicing the mortgage:
· before last decade’s housing boom got underway, in 2001
· when house prices peaked, in 2007
· according to the latest data as at March 2013.
Graph 1.4
Graph 1.5
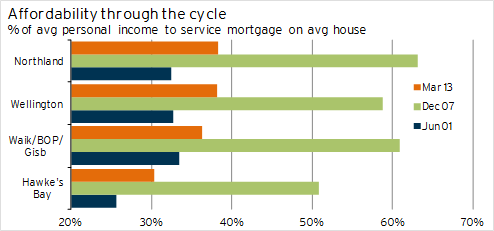
The graphs show that housing affordability across all countries has improved vastly since the end of 2007. However, with the exception of Northland, housing affordability is still worse now than it was prior to last decade’s extended housing boom.
The difficulty with this measure of affordability is that mortgage rates are currently at 48-year lows (and even longer if we take fixed mortgage rates into account). By this measure, servicing a mortgage appears to be reasonably comfortable around most parts of the country, with Auckland and Central Otago the least affordable areas. However, servicing the mortgage would obviously become more difficult if mortgage rates were at more “normal” levels by historical standards.
Graph 1.6
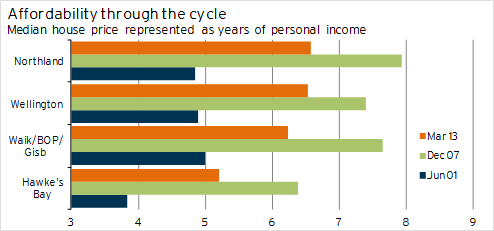
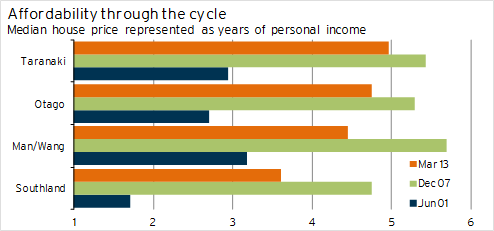
So let’s strip out the effect of mortgage rates and look at the amount of debt that new homeowners are being asked to take on compared to incomes. Graph 1.7, Graph 1.8, and Graph 1.9 show median house prices around the country in terms of the number of years’ worth of income they represent.
Graph 1.7
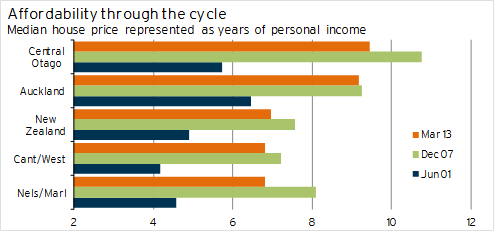
From these graphs, it is clear that housing affordability is at its most critical in Auckland, Canterbury/Westland, and Central Otago. For Canterbury/Westland, the cause is obvious, with as much as 9% of the region’s dwelling stock destroyed by the devastating earthquakes in 2010 and 2011. In Central Otago Lakes, the problem of affordable housing has been a longstanding one given the dichotomy between low-income service workers in the area and wealthy property owners who don’t work in the region.
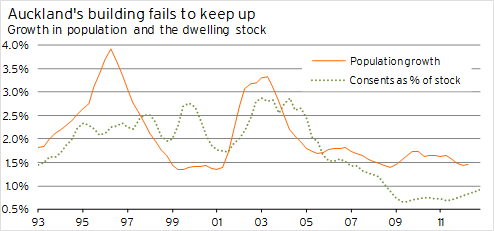
Although Auckland has historically had relatively expensive housing compared with other regions, the affordability of housing worsened significantly between 2001 and 2007 and has failed to improve much since then. The persistence of high house prices in the region since the Global Financial Crisis is in part a simple supply and demand issue. Graph 1.10 compares Auckland’s population growth with the rate of growth in the dwelling stock in the region. Since late 2005, Auckland’s build rate has failed to keep pace with population growth, let alone making any allowances for scrappage of obsolescent houses or for downward pressure on the occupancy rate.
Graph 1.8
Graph 1.9
Graph 1.10
National finds its Auckland ambition
As the Auckland housing market heated up during 2012, increasing pressure came on the government to provide a policy response to rising property prices. National’s first announcement, in October last year, was underwhelming, consisting of four aims to:
· increase the land supply for residential development
· reduce delays and costs of Resource Management Act processes associated with housing
· improve the timely provision of infrastructure to support new housing
· improve productivity in the construction sector.
All of these aims were vague – the most detail behind any of the objectives was a six-month time limit on council processing of RMA consents associated with medium-sized subdivision developments, rather than the average processing time of three years. However, it was not clear what ideas, if any, the government had to actively increase the land supply or improve productivity. There was certainly little suggestion that the marginal policy aims outlined above would have a significant effect on the affordability of housing or work to quickly turn around the under-building that has affected the residential construction sector over the last five years.
In November last year, the Labour Party upped the ante in housing policy with the announcement of its proposed KiwiBuild programme (see Labour’s recipe for intervention for more detail). National’s response was to establish a working party with Auckland Council looking at the city’s housing problems. This working party was followed up in May by the announcement of the Auckland Housing Accord. The Accord enables the government and Auckland Council to work together to streamline housing developments, where they are consistent with Auckland’s impending Unitary Plan, in certain parts of the city. The Accord aims for a total of 39,000 new dwelling consents in brownfield areas and/or new subdivision consents in greenfield areas over the three years to June 2016, with:
· 9,000 consents in the first year to June 2014
· 13,000 consents in the next year to June 2015
· 17,000 consents in the final year to June 2016.
These figures seem particularly ambitious given that residential consent numbers in Auckland peaked at 12,937pa in 2004. Even at the height of the building boom in the first half of the 1970s, we estimate that total dwelling consent numbers in the Auckland region would only have reached about 14,000pa.
Another potential problem with National’s policy approach to the Auckland housing market is that it implicitly assumes the availability of land is the primary factor holding back residential property development in the region. If there are other constraining factors at play, then reducing red tape and better facilitating new subdivisions are not necessarily going to translate into a commensurate increase in residential construction activity.
In summary, National expects the market to deliver greater construction volumes with minimal intervention or assistance from the government, with politicians’ main influence limited to ensuring that red tape or planning regulations do not unduly restrict development activity.
Labour’s recipe for intervention
Labour’s proposal places much less faith in the market’s ability to satisfactorily remedy the affordability problem and deliver the new housing that is required. The KiwiBuild programme put forward by Labour plans to build 100,000 affordable houses over a ten-year period. Labour believes that a lack of entry-level houses being constructed is one of the biggest barriers to home ownership, and states that 30-35% of new houses in the 1960s and 1970s were entry-level homes, compared with just 5% now.
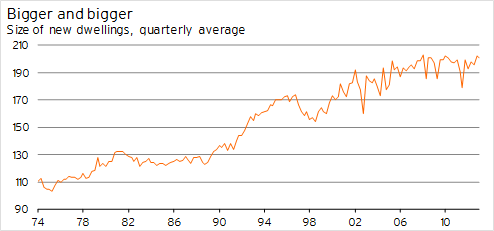
One of the best demonstrations of the changing trend in new house building is the average size of new dwellings over the past 25 years (see Graph 1.11). The average size of new dwellings has lifted from 126m² to 199m² since 1988 and is among the largest in the world. Indeed, while strong population growth at times during last decade’s housing boom meant that the high residential build rate was mostly justified, there still appeared to be overinvestment in residential construction occurring as the size and value of new properties rose to unprecedented levels.
Graph 1.11
Interestingly, if we look at house price quartile data by region, there does not appear to be any discernible closing of the gap between the lower quartile price and the median price over the last eight years. So although new additions to the housing stock have been concentrated at the upper end of the spectrum, the apparently constrained supply of lower-quality and/or smaller housing has not seen the affordability of these houses deteriorate any more than for the average house. Furthermore, the ratio of lower quartile to median house prices is fairly consistent across different regions.
The premise of KiwiBuild is effectively that the market is not providing a broad enough range of housing options when new dwellings are being constructed, and that there is a segment of unmet demand for smaller houses. High land prices mean that it is not profit-maximising for developers to build small or low-value houses on what are relatively expensive sections. Large-scale government-backed construction of smaller and cheaper new houses would help to bring down the average value of properties in the dwelling stock. Furthermore, if the total increase in the supply of new dwellings coming onto the market was sufficiently rapid, it could also quell house price inflation and possibly even lead to some price falls.
However, we note that one of the key difficulties with KiwiBuild is that the policy presupposes that there is genuine demand for smaller houses – something that is difficult to judge given the lack of any real supply to the market over recent years.
Why are we undersupplied, especially in Auckland?
The landed gentry
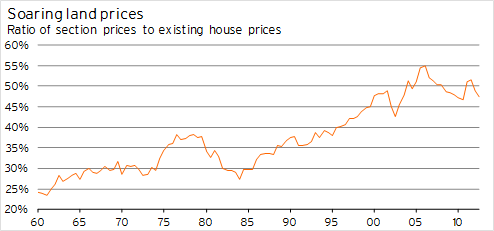
Talk to different people within the construction industry and you’ll get a multitude of responses as to why the provision of new housing in New Zealand is so expensive. The cost of land is widely acknowledged as being a major factor in the high cost of new houses, and the role of land prices is amply demonstrated in Graph 1.12. The graph shows that the ratio of section sales prices to house sales prices has climbed from 24% to 48% since 1960, with virtually uninterrupted growth between 1984 and 2006.
Graph 1.12
However, understanding why land prices have risen so much faster than house prices in a country where land is relatively plentiful is not so straightforward. The following are possible factors behind the disproportionate lift in land prices.
· Urban limits and zoning restrictions put in place by local councils are often blamed.
· Development levies imposed by councils when subdivision takes place also add a significant amount to the final land price.
· The underlying productivity of the land and its ability to generate revenue through alternative uses may have lifted, meaning that placing new housing on what was previously farmland faces a higher opportunity cost.
· Land aggregation, land banking, and constraining the supply of land available for residential development can sometimes be viewed as a good investment option. Strong capital gains, particularly around Auckland over the last 20 years, may have encouraged this sort of speculative behaviour, particularly if landholders are able to avoid paying tax on any capital gains they receive.
· Although average section sizes have been falling over the last 50 years from the once-traditional quarter-acre, it is possible that section sizes have not shrunk sufficiently to adequately mitigate the higher per-square-metre cost of land.
· Related to the previous point, more intensive housing options such as terraced housing or apartments have not been commonly pursued, thereby restricting any possible reduction in the amount of land needed for each new dwelling unit.
Earlier this year, Motu completed an excellent piece of research modelling the New Zealand housing market on a regional basis.1 Motu’s research shows that section prices are positively influenced by:
· farm prices (which rose by 216% between 1998 an d 2007 as rising commodity prices were capitalised into land prices)
· development and financial contributions payable to local councils (which in some areas increased substantially last decade)
· house prices
· population pressures (Auckland has historically maintained population growth well above the national average)
Of these factors, the latter two are demand-side drivers that would, all other things being equal, be expected to feed through into an increase in the quantity of new dwellings supplied to the market over the medium term. However, increases in section prices due to rising farm prices or higher development contributions hit the supply of land available for residential purposes. This constraint will persist until existing house prices have risen sufficiently to redress the balance between the cost of buying an existing house and the cost of building a new house (including the associated land price). Nevertheless, section prices will remain permanently higher as a result of these factors.
The difficulty for the Auckland housing market over the last few years is that the lack of supply as a result of high land prices has been exacerbated by financial market conditions. Motu’s research shows that the supply of new dwellings reacts negatively to changes in the restrictiveness of credit (a factor that also drags down existing house prices). The aftermath of the collapse of New Zealand’s finance companies and the Global Financial Crisis has had a massive effect on the rate of new residential construction. Motu’s model shows that the undersupply of new housing eventually pushes house prices back to their baseline level, while leaving the size of the dwelling stock below its baseline level over the long-term (ie for more than five years).
Since the middle of last year, there has been a clear improving trend in credit conditions. It is likely that this trend is contributing to the current renewed lift in Auckland’s house prices, but it should also foster a recovery in residential building activity going forward as well.
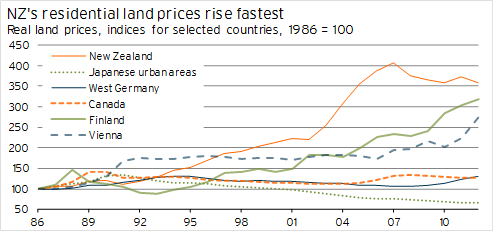
Even so, the price of land in New Zealand has still risen spectacularly fast by international standards over the last 25 years. Data on land prices internationally is hard to come by, but for the limited number of countries for which we have data available, New Zealand tops the lot. It’s both a long-term and shorter-term phenomenon – the growth of 13%pa in real terms over the five-year period from 2002 to 2007 outpaces any stretch of five-year growth across the other countries as well.
Graph 1.13
More intensive housing options
As a result of the long-term nature of the ongoing lift in New Zealand’s land prices, we cannot rule out the role that zoning limitations may have played in inflating land prices. However, question marks must also be raised about the lack of supply and/or lack of demand for more intensive housing options. If high land prices are a major driver of high property prices overall, then a natural response from households would be to consume less land. Are we too wedded to the old quarter-acre dream? Or are we being force-fed land parcels that are simply too large given today’s land costs?
There was a feeling 15 years ago that the burgeoning apartment market in Auckland and, to a lesser extent, Wellington, was the way of the future. Apartments were seen as a viable housing option for flatting students or young professionals, empty-nesters looking for an inner-city lifestyle, urban workers with a rural or semi-rural home for the weekends, or immigrants accustomed to more intensive living conditions and dense urban areas. But a range of factors have prevented apartment living from progressing very far over the last seven years, including:
· the relatively thin market and associated price volatility putting off potential buyers
· more restrictive lending conditions imposed by banks on apartments compared with traditional housing
· stories of substantial rises in ground lease costs or body corporate fees
· the construction of very small or low quality apartments, which were often sold at overinflated prices, making a good profit for the developer but ultimately not providing the purchaser with value for money
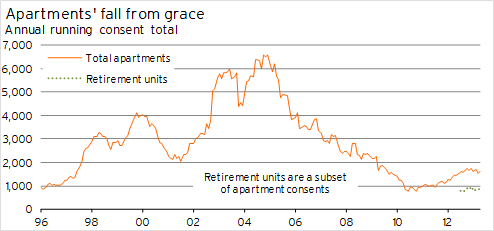
By 2010, the annual total of apartment consents was down 88%, or 5,826 consents, from its peak in 2004. Although apartment consent numbers have since lifted by 853 consents per annum, it is worth noting that 54% of the consents over the last year have been for retirement village units rather than genuine apartments.
The lack of any solid demand for apartments, combined with the unwillingness of banks to become financially involved to any degree in apartment developments, is a factor in the lack of intensification in the dwelling stocks of the main urban areas. However, there is also the issue that new large-scale residential developments will typically be on the outskirts of urban areas. It is likely that, if they are forced to commute a considerable distance to work, many people will demand a larger house and land package to compensate for the inconvenience of commuting. In other words, the location of most new residential developments is inconsistent with the construction of more intensive housing options such as terraced housing.
Graph 1.14
This point is not to say that more intensive developments cannot occur. In Auckland, for example, developments at Mt Wellington, Tamaki, and Hobsonville are sufficiently central for relatively intensive housing to be demanded. However, obtaining tracts of land that are not in outlying areas is likely to be the exception rather than the rule.
Furthermore, many new residential developments include covenants dictating minimum section sizes, minimum site coverage, or preventing future subdivision. These arrangements also work against any potential intensification in some urban areas.
Where such limitations do not apply, infill housing enables greater population density, but it is almost certain to be less efficient in terms of land use than brand new developments.
As part of the debate about the growth and development of Auckland over the next 30-40 years, Auckland Council has developed a housing simulator that enables users to alter assumptions about building height restrictions in different parts of the city, housing density, the types of new homes built, and building on land that is currently countryside.2 The simulator inadvertently provides an interesting insight into the thinking of planners – nowhere is there any indication of the effects of different decisions on the prices of different property types. For example, around half of the “required” 400,000 new homes in Auckland over the next 30 years can be provided by putting height limits up to the maxima allowed on the simulator. Although this solution is extreme, it may be attractive to those planning advocates that wish to limit urban sprawl. However, the model fails to indicate the effect of the heavily constrained stock of traditional housing, which is likely to rise significantly in price if current preferences towards standalone housing persist. Failure to incorporate or communicate the price effects means that people may try to pursue the inconsistent aims of a constrained land supply and more affordable housing – particularly when the “not in my backyard” attitude comes into play.
Forced elsewhere
The reality is that there is a complex interconnection between the availability of employment, the affordability and liveability of housing, and where people choose to settle. Absent any affordability or liveability constraints, people will generally choose to live where the best work opportunities are available. However, once affordability becomes an issue, people may be unwilling or unable to live near where the jobs are. At its most critical, housing can effectively become a constraint on the labour supply and, ultimately, a region’s economic growth.
Given Auckland’s affordability issues, it is reasonable to expect neighbouring regions such as Waikato and Bay of Plenty to experience spill-over growth in business activity, employment, and population growth. We also note the trend evident at the 2006 census whereby Auckland suffered a net interprovincial migration outflow to all other regions within New Zealand except Wellington and Manawatu-Wanganui. This trend was a contrast with 10-15 years earlier, when Auckland was recording a net interprovincial migration inflow from almost all other regions.
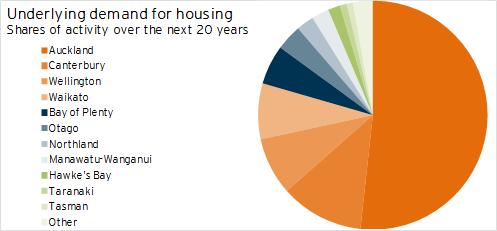
Standard population projections from Statistics NZ suggest that about half of all new dwellings over the next 20 years will need to be constructed in Auckland, with Canterbury the only other region recording a share of activity of over 10%. If Auckland’s housing affordability issues do not start to be addressed, there is a real possibility of population growth and demand for housing in Waikato and Bay of Plenty exceeding current expectations.
Graph 1.15
Reserve Bank’s action not about affordability
This year has also seen the Reserve Bank becoming increasingly concerned about house price inflation, with the Bank looking beyond the traditional mechanism of interest rates and considering alternative macro-prudential tools for quelling the housing market.
Let’s be clear, though – the Reserve Bank is not concerned about housing affordability as such. Rather, the Bank is focused on maintaining the robustness and stability of the financial sector. If house prices are overvalued or there is a significant risk of price falls, the Reserve Bank’s aim is for the trading banks’ lending practices to have been sufficiently conservative to ensure they still have greater assets than liabilities. In other words, the trading banks should have a big enough capital buffer to enable them to withstand a large fall in house prices (eg 30%) and still have a positive balance sheet.
The Reserve Bank has announced an increase in the risk weighting for mortgage lending with a loan-to-value ratio of over 80% from the end of September. This relatively targeted measure will force banks to keep relatively more capital on hand for high-LVR mortgage lending, effectively increasing the cost of funding for these mortgages. As such, the policy is likely to result in higher interest rates for high-LVR mortgages compared to mortgages with more than 20% equity. The policy effectively formalises and strengthens the approach that some banks already take, offering lower interest rates to borrowers with more equity.
The Reserve Bank’s new measures may help to quell house price inflation, as the higher financing costs faced by potential low-deposit house buyers will increase the marginal cost of purchasing a property and force them to better consider the associated risks. Although it is possible that the Reserve Bank’s policy helps to improve housing affordability over the medium term, it clearly reduces the ability of first-time buyers to enter the market as they face either higher deposit requirements or higher mortgage rates. In other words, any action by the Reserve Bank is effectively a red herring when it comes to addressing housing affordability.
Simply ripped off by builders?
One area we have not covered so far in our discussion of housing affordability is building costs. In its Housing Affordability Inquiry published in March 2012, the Productivity Commission found that per-square-metre building costs in Australia were as much as 20% lower than in New Zealand.3
Turner & Townsend’s 2012 International Construction Cost Survey4 provides per-square-metre building cost data for a range of 16 countries. The building costs for a medium standard detached house are shown in Table 1.1, both in local currency terms, and using purchasing power parity measures from the World Bank to convert the figures to a common base.
Unfortunately, Turner & Townsend do not include New Zealand construction costs in their Survey. However, we are able to utilise building consent data to estimate similar figures for New Zealand. The only discrepancy in the data arises from Turner & Townsend’s inclusion of “preliminaries”.5 Table 1.2 shows New Zealand construction costs analogous to those in Table 1.1 allowing for different levels of preliminary costs.
If we assume that preliminary costs are on a par with Australia, which is a relatively high proportion of the total build cost, then per-square-metre building costs in New Zealand are still cheaper than in most other countries in the survey. Even if we look at the costs of building medium-density apartments, New Zealand is still better than average in terms of building costs.
Of course, residential building costs in New Zealand have risen significantly over the last