Will new dwellings keep getting bigger?
Our last set of forecasts, published in July, showed a renewed increase in the average size of new dwelling consents in New Zealand from 191m² in the June 2012 year to 223m² by June 2016. This 17% lift over the course of four years looked all the more surprising given that the 2012 figure was lower than the average size of new dwellings in 2005/06 and was just 3.3% above the equivalent number from a decade earlier. So are we being too bullish about future growth in average dwelling sizes?
In looking at the average size of new dwellings, it’s useful to distinguish between apartments and non-apartments. For non-apartments, our model for the average floor area is based on GDP per capita, which is a proxy for incomes. As a household’s income rises, that household will generally consume more goods and services, and housing will be a part of the trend. The increased “consumption” of more housing may include larger dwellings, better-quality fixtures and fittings, or property in a more attractive location. Essentially, any factor that increases the real cost of purchasing a property equates to increased consumption of housing, and floor area is one of the responses to rising incomes.
For apartments, our forecast of the average floor area reverts to a “normal” level over the medium term. This methodology is based on the premise that demand for apartments is based on location rather than dwelling size. So for a subsection of the population, as their incomes rise, they would rather choose the central-city location offered by an apartment than a bigger house out in the suburbs.
International comparisons
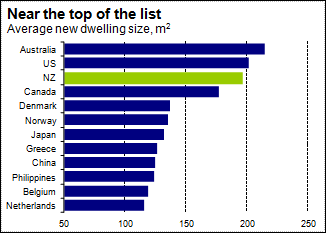
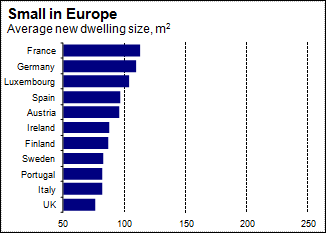
How does the size of New Zealand’s new dwellings compare on the global stage? Graph 1.1 and Graph 1.2 show that New Zealand is near the top of the list of countries for which we have data, and well ahead of new dwelling sizes in Europe. Unfortunately, data for developing countries is in short supply, but data for China and the Philippines shows that even the average new dwelling sizes in these countries is larger than across most of Europe.
Conceptually, a range of factors will influence differences in new dwelling sizes between countries. These possible factors include:
- relative incomes – people in wealthier countries will be able to afford bigger houses than people in poorer countries
- household size – a greater number of people per dwelling suggests the need for a larger house size (notwithstanding a possible negative correlation between average incomes and family sizes)
- the availability of land – countries with a higher population density will necessarily have higher density housing, pushing the mix of new dwellings more towards apartments and other multi-unit dwellings, reducing the likelihood of large houses being built
- the “age” of the economy – an economy that developed earlier is likely to have an existing stock of dwellings with a relatively small average floor area, conditioning people’s expectations about what is a reasonably sized dwelling given a certain income level

Graph 1.1

Graph 1.2
The last point hints at, but does not fully cover, different cultural expectations about house size. Right across Europe, expectations about house size appear to be markedly smaller than in North America and Australasia. Indeed, cultural differences, influenced by a country’s population density, existing dwelling stock, and history of economic development may help to explain the similarities in new dwelling sizes between the three Asian countries we have data for.
In short, we believe that most cross-country comparisons of new dwelling sizes are not particularly useful given the cultural differences that exist between Europe, Asia, and Australasia. A comparison with Australia is perhaps the most valid one to make given the Trans-Tasman similarities in culture, demographics, and economic history. The only area where Australia is significantly different to New Zealand is its higher GDP per capita.
An Australian benchmark
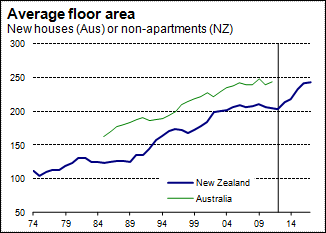
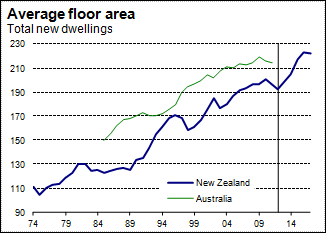
Evidence from Australia suggests that average floor area of new dwellings in New Zealand probably hasn’t reached a maximum yet. Graph 1.1 shows the historical trend in the average size of new standalone houses in Australia and new non-apartments in New Zealand. 1 The latest available Australian data, for the nine months to March 2011, shows the average size of a new standalone house in Australia was 244m², about 19% above the comparable New Zealand figure for non-apartments. If we look at all dwelling consents, which helps get around definitional differences, the figures are 214m² and 196m² for Australia and New Zealand respectively (see Graph 1.2). Taking the view that where Australia goes, New Zealand follows, it would seem that there is still potential further growth in the average size of new dwellings here.

Graph 1.3
Research from across the Tasman by CommSec provides conflicting signals about where the average new dwelling size in Australia may go to from here. CommSec has looked at the fact that the average size of new houses in Australia has virtually gone sideways over the last five years and provided a number of factors that suggest that the average home size could be near or at a peak.
- Demand for additional bedrooms and/or living areas must stop increasing at some point. We note that less growth in the number of rooms in new houses could be replaced by demand for those rooms to simply be built larger. However, it is also worth remembering that part of the lift in average dwelling sizes over the last 25 years will have been caused by the increased prevalence of internal access garages. This structural shift away from standalone garages, which are not counted as part of a dwellings floor area, will not be repeated.
- Consumers have become more conservative in their spending choices over the last few years as a result of the Global Financial Crisis. We note that, although the after-effects of the GFC on consumer behaviour are likely to persist for a long time, there importance will fade after a decade and a new generation of consumers will start to come through with different spending patterns.
- Generation Y places less importance on home ownership than previous generations. However, we note that lower home ownership rates do not necessarily translate into less demand for housing space – the changes in demand patterns may result in an increase in the quality and average size of rental housing.
- The aging population points to less demand for bigger homes. We note that this demographic trend should be adequately captured in the downward trend in occupancy rates (the number of people per dwelling).

Graph 1.4
These arguments put forward by CommSec would all suggest that the average new home size in Australia will not rise much further. However, CommSec has also pointed out that estimates of the Australian occupancy rate have risen over the last decade. Children are staying at home with their parents for longer. Health advances and the aging population may also result in an increase in the number of multi-generation households. New immigrants may also choose to stay with friends or family, reflecting the greater incidence of living arrangements other than the nuclear family in non-Western societies.
Maxing out, or just weaker income growth?
We think the jury is out on whether recent increases in the occupancy rate on both sides of the Tasman are a function of sociodemographic factors or are more a reflection of a lack of supply of new dwellings making accommodation less affordable, combined with the negative income effect of the GFC. Over the medium to longer-term, our core view remains that the occupancy rate in New Zealand will resume its decline in line with the aging population.
At this stage, we believe the increase in occupancy rate and decrease in the average size of new dwellings are consistent with the economy’s poor performance over the last four years. When the economy clearly moves into a recovery phase, we expect a bounce-back in average new dwelling sizes from their recession-induced dip.
Even in the US, where the average new single-family home size has shrunk from 234m² to 222m² between 2008 and 2010, we are reluctant to view the shift as a permanent shift in consumer behaviour. Rather than a backlash against the perceived excesses of the ever-larger “McMansions” that have been built, we see the reduction in the average new home size in America as a natural reaction to the downturn in the country’s housing market and broader economy.
Apart from the cyclical economic factors mentioned above, we also see three factors of a more structural nature that may have led to a one-off decrease in the average dwelling size in New Zealand over the last few years.
- National accounts data suggests that New Zealanders were “overinvesting” in housing during the last decade, with residential investment spending making up a much larger-than-normal share of economic activity. Reduced expectations about property price appreciation will have discouraged this overinvesting behaviour and are likely to have contributed to the recent reduction in the average size of new houses.
- The government’s changes to the tax treatment of investment property have made investing in property a relatively less attractive proposition. The reduction in investor demand for housing may also have had a negative effect, at the margin, on dwelling sizes.
- The disappearance of the finance companies from the property development sector in New Zealand has effectively placed a credit constraint on the residential construction industry. These tighter credit conditions have fed through into a lower number of new dwelling consents, but may also have reduced the average size of those new dwellings as well.
These factors present the possibility that the average size of new dwellings in New Zealand may not rebound from its present lows as quickly as we are currently anticipating.
One final point that may influence average new dwelling sizes in New Zealand over the next 5-10 years is the effect of earthquake rebuilding work in Canterbury. The average size of houses destroyed in the Christchurch quakes will be well below the average new dwelling size. If, as part of the insurance arrangements, red-zoned dwellings are replaced with new houses of the same size, it would imply that new dwellings in Canterbury could be as much as 20-30% smaller than the average new house built under more typical economic conditions.
[1]There are definitional differences between New Zealand and Australia regarding the statistical split of housing. New Zealand data splits residential consents into apartments (ten or more dwelling units attached to each other) and non-apartments, whereas Australian data splits residential approvals into standalone houses and other residential building (semidetached, row, or terrace houses or townhouses, and flats, units, or apartments).


