What have consumers been spending on?
Statistics NZ recently released triennial information on spending by households in the June 2013 year. By using these figures we can get an idea about how household spending has changed since the Global Financial Crisis.
The retail trade survey and electronic card transaction data (both provided by Statistics NZ) offer a useful and timely analysis of retail spending by New Zealanders. However, both data sets are based on the focus of specific retail industries – not on the particular goods and services that New Zealanders have purchased.
Every November, the Household Economic Survey (HES) is released. This survey captures what is going on in personal and household income by surveying individual people and households. Every three years this is supplemented by an expenditure diary, where people write down what they have been spending their money on. One of these larger surveys was run in the year to June 2013 and released in November 20131.
This data provides us with another way to look at household expenditure, one that provides a clear and detailed breakdown of exactly what households have been spending on. For example, last time we discussed this data2 we discovered that, between June 2007 and June 2010, the drop in spending by households on a variety of durable goods was stronger than the retail trade survey had suggested – implying that speciality durable goods stores and online retailing had gained market share from department stores in this space.
So what do the June 2013 figures tell us about households’ spending habits?
Consumer spending: value trends
An important question for retailers, and for analysts interested in consumer behaviour, is that of how the proportion of consumer spending on different goods and services types has changed over time.
The past three full Household Economic Survey (HES) releases are well timed in this regard – with results released for the June 2007 year (prior to the recession and global financial crisis), the June 2010 year (directly following the crisis), and the June 2013 year.
The measure of household expenditure we are using here stems directly from the HES. We are looking at total expenditure excluding trade-ins and refunds – as a result, the total sales figure will exaggerate total sales, especially for durable good spending. As a result, our focus will be on rates of change and changes in the share of different good types, rather than the level of spending.
Over those six years, the HES indicates that household expenditure rose 23%, or 3.5%pa. The value of expenditure rose more between 2010 and 2013 than it did between 2007 and 2010. Although GST was hiked in October 2010, the lift in sales activity was still genuine. Even with the GST hike, the prices of consumer goods and services actually rose less swiftly in the three years to June 2013 than they did in the three years to June 2010!
So what trends have we seen in the composition of consumer spending? To help answer this question we are going to split spending into six very broad groups: food and clothing, housing services and durables, transport, communication and recreation, miscellaneous (including health and education), and other.
Graph 5.21
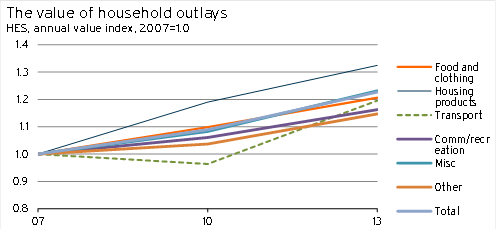
The housing services and durables category experienced the strongest growth in the value of spending during this period, up 32% between June 2007 and June 2013. However, spending on house and durable goods performed very differently to spending on services for housing.
A massive lift in spending on rent and mortgage principal repayments during this period was the key driver of higher spending in this category, up by 54% and 43% respectively. Lower interest rates and a reduced willingness to take on risk have seen households strongly increase their rate of mortgage repayments (a form of savings) during this period – boosting expenditure in this category.
However spending on selected household items and services, which largely includes household durable products (eg furniture) rose by only 4.1% during these six years.
Household spending on selected items and services dropped sharply between June 2007 and June 2010 (down 6.3%), as consumers cut back expenditure in the wake of the Global Financial Crisis. Spending on these items has risen in line with general spending over the last three years, but that has not been enough to make up lost ground. As a result, expenditure on selected household items and services as a share of total spending fell from 5.0% to 4.3% between 2007 and 2013.
In the transport industry spending fell between 2007 and 2010, and this broad industry was the only one to experience a decline in the value of sales. However, by June 2013 spending in the sector had rebounded, with the growth in sales values between 2007 and 2013 only slightly behind the lift in overall spending. Although new car sales and international travel experienced sizable increases (up $5.7m and $7.5m respectively), most of the increase in transport expenditure was due to higher spending on petrol (up 35%, or $21m).
Over the past six years, the main broad sector that underperformed the average in terms of the value of spending was the communication and recreation industry. Although this grouping seems like a strange one, the trends among communication-related goods (primarily telecommunication services) and recreation-related goods (which will include electronic products associated with communication, along with other recreational products) were similar.
Communication spending rose 20% between June 2007 and June 2010, but only 3.0% between June 2010 and June 2013, as additional competition and technology changes had an effect on prices in the market. Recreational good spending rose 1.6% in the first three years, as households cut back on durable good spending during the Global Financial Crisis. However, recreational good spending rose 12% between June 2010 and June 2013.
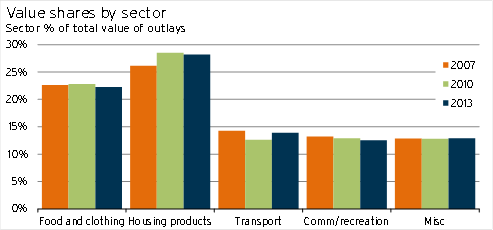
Given these shifts, the share of total consumer spending among the different broad categories changed in the following ways. The share of spending on housing services and durables has risen, the share of spending on communication and recreation goods fell consistently throughout the period, the share of spending on food and clothing eased, while the share of spending on transport goods slumped then recovered.
Graph 5.22
Consumer spending: volume trends
One of the issues with only looking at spending data is that it doesn’t tell us whether spending changed because people were buying a different quantity of the product, or whether it changed because the prices of goods and services (including quality adjustments) shifted.
As the Household Economic Survey categories are roughly consistent with the categories in the Consumers Price Index, we can use data from the CPI to adjust the HES spending figures to give us an indicator of the “volume” of sales in each broad spending category. So how does this volume data compare to the value data?
The communication and recreation sector looks very different when we consider the volume of goods and services sold instead of the value of spending on those goods and services. Although the value of spending on communication and recreation goods and services rose 16% during the six years between 2007 and 2013, the volume of goods and services purchased in this sector rose by 25% – implying that prices fell!
Behind the price decline in this sector has been two overarching factors: weak import prices (due to a high exchange rate and weak global demand for manufactured goods), and quality improvements in electronic goods (eg smartphones, computers, TVs). In the communication sector specifically, rising competition over phone and broadband plans also pushed down prices and increased the estimated quality of service.
Graph 5.23
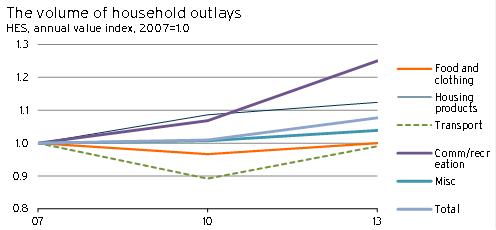
The pullback in the volume of transport goods and services between 2007 and 2010 was a lot more significant than the value figures suggest. The price of transport goods and services rose 8.0% during this period (slightly below the lift in the overall CPI), largely due to high oil prices. Households responded to this price increase, along with the economic slowdown, by slashing the volume of vehicles and the quantity of fuel they purchased.
However, looking carefully through the data it is possible that the HES may be overstating the decline in transport retailing during this period. The “purchase of new vehicles: category is missing in the 2010 HES. On the face of it, this omission indicates that sales were too low to be directly published, but it is also possible that there was some “category jump” in reporting, where new vehicle expenditure was inadvertently included in a different part of the report. Nevertheless, even if this category had been excluded in the 2010 HES, its inclusion would not have prevented a decline in the volume of transport retailing.
When comparing the 2007 and 2010 HES, one surprising result was the strength in the volume of housing services and durables. The 19% lift in the value of sales in this sector was split fairly evenly between price rises and volume increases, with the volume of sales up 8.6%.
There are a few interesting points of note that come out of these volume figures.
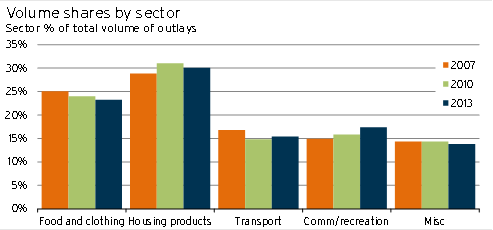
- The share of households’ shopping basket made up of communication and recreation goods has risen considerably over the past six years. Furthermore, this increase has taken place while the amount spent on these products (as a share of total spending) has declined. Part of the reason for this divergence is because the trend of improvement in communication and recreation spending may be being exaggerated, due to the strong assumptions around quality adjustment in the spending figures[3]. However, the figures do indicate the significant effect that technological change is having on household spending habits.
- The share of households’ shopping basket made up by food and clothing has declined – largely due to lower clothing purchases. Given the drop in domestic clothing retailing in New Zealand, it was an open question whether households were buying fewer clothes, or whether they were shopping much more online. As these figures should capture online shopping by households, they suggest that consumers have been more restrained with their clothes purchases in recent years, and/or the price measures of clothing currently used by Statistics NZ are overestimating the true price paid by consumers.
- The share of households’ shopping basket on housing services and durables has risen markedly. According to the more detailed data, the “volume” of spending on rents rose 36%. Furthermore, although there is no CPI series for mortgage principal repayments, the 46% lift in the value of spending here heavily exceeded the 12% increase in quality-adjusted house prices during this period. The figures imply that households have distinctly increased the quantity of housing and housing related savings they have been consuming over the last six years!
Graph 5.24
With interest rates rising, the importance of online shopping growing, consumer confidence on the rise, and China no longer willing to subsidise cheap manufactured goods to the same degree, we do not expect these trends to continue over the next six years.
Specifically, although we expect technological improvement for communication and recreation goods to continue, the ability to further cut prices will not remain in the face of Chinese rebalancing and a falling New Zealand dollar. The volume of spending on these items will stay high, but this outcome will also imply that the value of spending will rise.
Online retailing will continue to increase access to clothing overseas at very cheap prices. In this environment, we expect a corresponding lift in the volume of clothing retailing over the next six years.
1 Note: The recently reported measurement errors in Statistics NZ HES data (www.treasury.govt.nz/publications/media-speeches/media/27feb14) do not have any effect on this survey result. The errors were with regards to disposable income, not consumption.
2 https://infometrics.co.nz/Forecasting/5596/901/Retail-Forecasts-November-2011—How-have-spending-habits-changed
3 Eg, the assumption that doubling the speed of a computer gives you double the usefulness of a computer.