Claiming back workers from the “lucky” country
Throughout the course of 2014, the number of people crossing the Tasman to live and work in New Zealand rose 19% from 2013. Prompting this change was a shift in the relative employment prospects between each of the two countries. This article looks into Australian labour market data to get a better idea of where employment is shrinking in Australia, and thus what types of jobseekers are likely to end up in New Zealand.
The borders dividing the Australian and New Zealand labour markets have long been porous. As a result, it has often been the case for workers to shift between the two countries to the one where employment conditions are more favourable. During Australia’s mining boom of 2003-20111, over 330,000 New Zealand-based people moved to Australia – compared to the relatively meagre 120,000 people coming back the other way. With Australia’s golden period tapering off, the migration tide has turned.
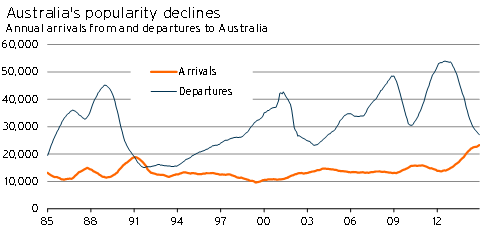
Despite Australia having the larger population, there has generally2 been a historical annual net outflow of people from New Zealand to Australia since records began in June 1980. This net outflow also tends to be substantial, with an annual average of 18,000 more people shifting to Australia than coming from across the Tasman in the past three decades. During 2014, there were still more people going to Australia than heading the other way, but this net outflow had shrunk to 3,797 people (from 19,605 people in 2013).
Graph 5.5
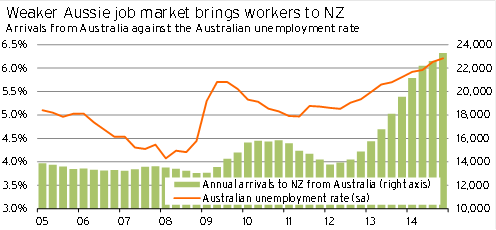
Although Australia’s economic growth was still at a relatively good 2.8%pa in September 2014, it has slowed from the more rapid pace of 3.8%pa two years earlier. As a result, the Australian unemployment rate climbed to 6.4% in January 2015 – its highest level since June 2002. This slowdown in economic and employment growth also comes at a time when economic activity and labour market conditions in New Zealand are improving. As a result, many Australian-based workers have moved to New Zealand.
Graph 5.6 maps the Australian unemployment rate against the flow of migrants from Australia to New Zealand. Acknowledging that there is a time lag between job losses and when people decide to move, we can see that increases in the Australian unemployment rate are often followed by a lift in arrivals from Australia to New Zealand.
Graph 5.6
Is it push or a pull?
Growth in long-term and permanent arrivals from Australia to New Zealand is usually a result of how both countries are faring in the world economy. As Australia has the larger labour market, any change in the New Zealand labour market means little when conditions in Australia move in the same direction. For example, during the mid-2000s, New Zealand’s unemployment fell more rapidly than Australia’s rate, but arrivals from Australia remained fairly consistent. The push to leave Australia must be present before New Zealand comes into consideration as a destination.
That being said, once Australians choose to leave, the relative state of the New Zealand labour market determines whether Australian residents choose to move across the Tasman or elsewhere. This factor can be seen when we compare the lift in arrivals in 2010/11 to the 2013/14 increase. With the Australian unemployment rate surging in 2009, departures from Australia during the following year jumped 10%pa. However, New Zealand’s unemployment rate also climbed during this time. As a result, there was only a small increase in migrants arriving from Australia throughout 2010. In contrast, over 2013/14 departures from Australia remained relatively unchanged, but the sharp improvement in the New Zealand labour market attracted a larger proportion of departing Australian residents to shift to New Zealand instead.
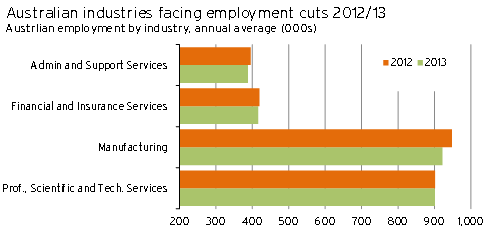
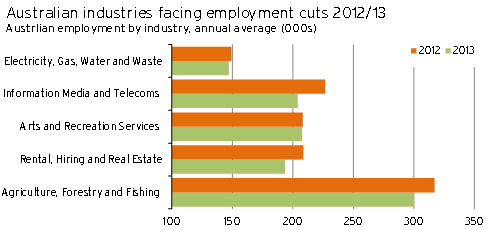
But with Australia as the primary push factor, the mix of skills among workers arriving in New Zealand is pre-determined by which Australian industries are making cutbacks, particularly in the year preceding the surge in arrivals. Industry employment data from the Australian Bureau of Statistics shows that employment numbers declined in nine out of 19 industries between 2012 and 2013. Graph 5.7 and Graph 5.8 illustrate the extent of the declines in employment for these respective industries.
Furthermore, unemployment levels in May 2013 were higher in 13 out of the 19 industries when compared to a year earlier. By May 2014, unemployment levels were higher than in May 2012 in all but three industries: financial and insurance services, arts and recreations services, and construction3. With a growing pool of unemployed workers across most industries in Australia, alongside improving conditions in the relatively easy-to-transfer-to New Zealand market, the skills mix of Australian workers shifting to New Zealand is likely to be diverse.
Graph 5.7
Graph 5.8
What skills will these new arrivals bring?
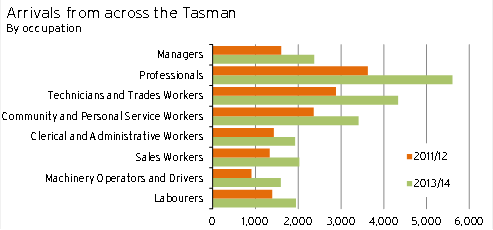
What is perhaps more important about the increase in workers moving from Australia is the types of skills these people bring with them to New Zealand shores. Statistics NZ breaks arrival data down by occupation. This data shows that about a quarter of the surge in arrivals4 from Australia over the 2013/14 period was due to a 55% lift in professional workers moving to New Zealand. A further fifth of the increase in declared occupations came under the trades and technical workers category (up 50% over the period). Arrivals with clerical and administrative skills increased the least, but were still 35% higher in 2013/14 than they were two years earlier.
Graph 5.9
These results align with Australian unemployment data, where the largest increases in unemployed personnel were among professionals, technicians and trades workers, and community and personal service workers. By May 20145, the numbers of unemployed workers in these three industries were 46%, 33% and 24% respectively higher than May 2012.
Comparing 2014 data to a year earlier shows that, although the lift in technician and trades worker unemployment has waned, unemployment among professionals as well as community and personal service workers continued its rapid climb. As trades workers and technicians are still in high demand, a reduced inflow of workers with these qualifications from Australia could see capacity tighten more quickly in this corner of the labour market. In contrast, the inflow of professional and community service workers from Australia is likely to remain high over the coming year.
Labour cost implications for New Zealand
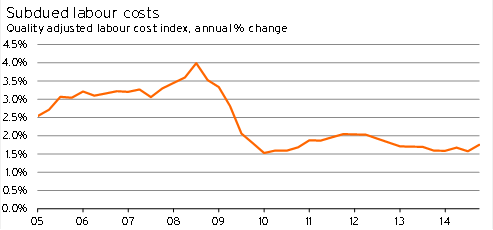
The surge in migrant arrivals from Australia has potentially helped alleviate labour cost growth in New Zealand. In the December 2014 quarter, labour costs were 1.8% higher than a year earlier. But it is unusual to see labour costs this subdued (see Graph 5.10) at a time of strong economic growth and high levels of employment. It is likely that softening labour market conditions in Australia have had some spillover to wage growth in New Zealand.
In the wake of the Canterbury earthquakes, labour costs for trades-workers were expected to accelerate rapidly. However, labour costs for trades-workers have grown at an average pace of 2.2%pa over the past four years6. In contrast, trades worker labour costs grew at an average pace of 3.6%pa between 2005 and 2009 (which, incidentally, was also the time when a large number of New Zealanders moved to Australia).
The recent influx of professionals also appears to have limited cost growth within the occupational group, with labour cost growth slowing to 1.4%pa in December 2014, compared to 2.1%pa cost growth three years earlier. Labour cost growth for clerks and sales and service workers also remained subdued, at 1.4%pa and 1.6%pa respectively.
Graph 5.10
In conclusion, the increased spare capacity in the Australian labour market, at a time when labour demand in New Zealand is increasing, comes as a boon for New Zealand-based employers. Not only do employers have a larger pool of workers to pick from, but due to the cultural similarities between Australia and New Zealand, and because employee cutbacks in Australia have only happened recently, these migrants are more likely to be work ready upon arrival.
The increase in workers arriving from Australia is also likely to have dampened labour cost pressures in the economy. Due to the lift in migrants across all occupation categories, the supply-side effect on labour cost pressures has been broad-based. Even in sectors where cost pressures are rising more rapidly, such as the construction industry, the influx of workers looks to have reduced the extent of labour cost growth. Looking ahead, as the Australian labour market remains relatively soft, and as ongoing migration from Australia helps New Zealand firms meet their employment demands, we expect labour costs to remain constrained through into 2016.
1 During this period, world prices for Australia’s resource exports rose more than 300% in US dollar terms).
2 The only times there was a net inflow from Australia to New Zealand were in 1983/84 and in 1991.
3 However, there were still an estimated 38,000 people unemployed in the construction sector in May 2014.
4 Of categorised occupations.
5 Detailed labour market statistics from the Australian Bureau of Statistics are collected on a quarterly basis in February, May, August, and November.
6 One point to note is that about one third of trades workers are self-employed and that, given the high demand for subcontractors, labour cost growth for the self-employed could be faster than for waged workers.