How much more durable good spending is still to come?
Durable good spending has been increasing strongly over the past year, which is a good sign given that this type of expenditure usually leads the economic cycle. How much further does the lift in durable consumer good expenditure have to run, and what effect may the new loan-to-value limits on mortgages have on this form of spending?
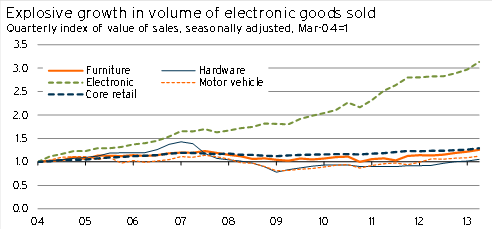
After a prolonged period of weakness, durable good spending started to rebound strongly during 2012, and by June 2013, the volume of durable goods purchased had surpassed its March 2007 peak (seasonally adjusted).
Graph 5.14

What has happened?
Over the past decade, there have been three clear drivers of the performance of durable goods sales.
- The general performance of the housing market and residential construction
- The cost of durable products
- The changing quality of durable products (hedonic adjustment)
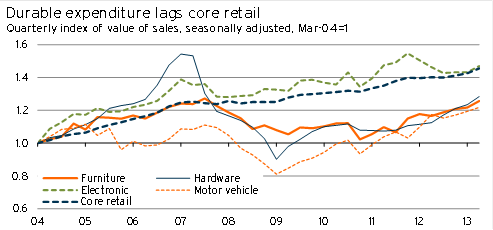
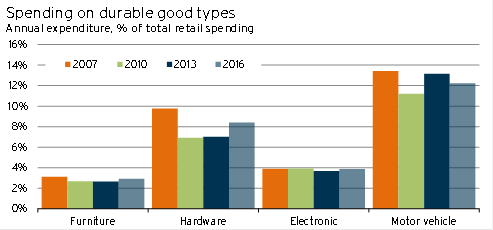
The relative performance of the different durable good types can be seen in Graph 5.15 (the volume purchased when adjusting for cost and quality) and Graph 5.16 (the value of spending).
Note that the durable good figures being discussed in this article are for speciality durable good retailers – not for the total value of sales for durable goods. In the 2004-2007 period, durable good spending in non-speciality stores (eg department stores) also rose sharply, and it subsequently fell even more significantly than speciality retailing did.
We are focusing on the speciality industries as we believe that the trend in durable good spending among different stores types for the same type of product will be similar. However, the market share between speciality and non-speciality retailers can often be subject to significant market changes. For example, the entry of Number One Shoe Warehouse led to a sharp increase in speciality footwear retailing at the expense of The Warehouse.
Graph 5.15
Graph 5.16
Electronic
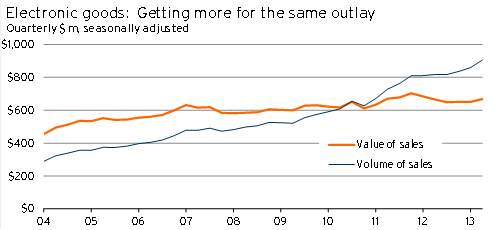
As can be seen in Graph 5.15, the “volume” of spending in speciality electronics and appliance good stores has gone through the roof over the past decade – more than tripling since March 2004.
However, this strong volume result stems largely from a sharp drop in the price deflator for electronic goods. The actual dollar value of sales in these stores was up by 47% (or 4.1%pa) between March 2004 and June 2013 – only marginally ahead of the 45% increase in core retail spending.
So what does this price deflator really tell us? Well it is a mixture of three drivers.
- Increasing competition and tightening margins for retailers in this space
- Lower costs due to the high dollar and competition between manufacturers overseas
- Technological improvement (hedonic adjustment)
In this context households have been able to get “more” electronic good for the same outlay.
However, we also believe that current adjustments to the quality of electronic goods may be overstating how much bang for their buck that consumers are getting. Sharp increases in the processing power of computers and cell-phones is nice, but the value to the consumer of these improvements is difficult to measure.
Graph 5.17
The combination of changing policy in China (discussed in Asian rebalancing: good, or a necessary evil?) and an easing in the exchange rate will see the price of electronic goods fall less sharply over the next three years.
With less negative price pressures, the value of sales is expected to pick up, rising above $3bn per annum by the end of 2015. However, the volume of activity is unlikely to record the same meteoric rise it has experienced in the last three years – with higher prices and a slowdown in growth in smartphone sales (now that a lot of individuals have upgraded their phones) behind the result.
Hardware and building supplies
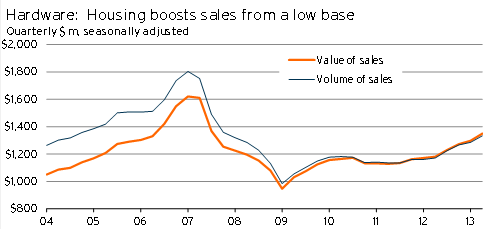
Speciality hardware and building suppliers experienced the rockiest ride of any form of durable good retailer over the past decade. Sales values shot up 54% between March 2004 and March 2007, only to come crashing down below their 2004 level by March 2009.
Furthermore, as hardware and building supply costs rose, the volume of activity in March 2009 was 22% below its March 2004 level, and only repassed its March 2004 level in December 2012. Relative to its peak in March 2007, the volume of hardware and building supply sales is still down 26%.
Demand from builders and home renovators is a large component of hardware and building supply sales. As a result, the strong volume of construction activity between 2004 and 2007 helped to support sales. Similarly, the dearth of construction and A&A activity in recent years saw sales activity in this store-type remain depressed.
There were two other factors helping to drive up the value of hardware and building supply sales in excess of the rise in building activity and housing market turnover.
- Rising house prices and easing credit conditions made home renovations more attractive.
- The emergence of Bunnings and Mitre 10 Mega helped to shift market share from department stores and other retailers to specialty hardware and building supply retailers.
Graph 5.18
The outlook for hardware and building supply sales is strongly tied to the outlook for residential construction. With residential work put in place expected to rise at an average annual rate of 15%pa in the three years to March 2016, we have pencilled in a sizable 11%pa lift in hardware and building supply sales values. This is well in excess of the expected 4.3% increase in overall retail sales.
Furniture
Furniture and floor covering retailing was hit hard by the slowdown in the housing market during the Global Financial Crisis, with the value of activity in 2009 falling towards its 2004 level.
However, with credit conditions starting to improve from late-2011, and housing turnover picking up, furniture and floor covering speciality retailing gained a head of steam during 2012.
Graph 5.19
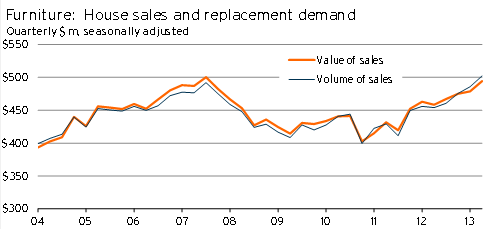
The outlook for furniture retailing is intrinsically linked to the performance of the housing market and the more general availability of credit for households.
With house sales expected to climb at an average annual rate of 10%pa in the three years to March 2013, and with house prices rising at an annual rate of 6.8%pa during the same period, there will be significantly stronger demand for furniture and floor covering goods.
As a result, we are forecasting 7.6%pa growth in the value of furniture and floor covering sales between March 2013 and March 2016.
Motor vehicles
Motor vehicle retailing was hit by the triple-whammy of elevated financing costs, high and rising petrol prices, and a domestic recession during 2008. As a result, motor vehicle retailing fell sharply, with the volume of sales in March 2009 sitting 19% below its March 2004 level.
Motor vehicles have seen the strongest increase in their “quality-adjusted” price rise over recent years. The higher implied retail price, more limited credit availability, and persistently high petrol prices are all factors that have seen a shift towards small cars – sales of which have substantially outperformed large cars in recent years.
Graph 5.20
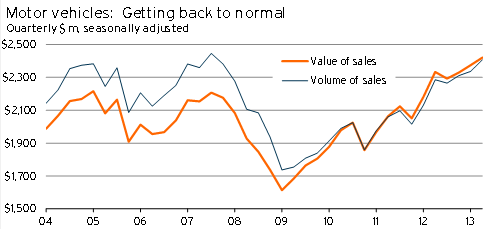
With motor vehicle retailing having now recovered from its recessionary hole, petrol prices staying high, and a high New Zealand dollar holding down car prices, the performance of motor vehicle retailing is expected to remain good. Annual motor vehicle retailing is expected to near $10bn by March 2016. However, relative to other durable products, sales growth in this industry is expected to be more moderate, at just 1.8%pa.
What does this growth in durable spending imply?
Given these outlooks for the various subcategories of durable goods spending, it is interesting to consider how much further the overall increase in durable good spending has to run.
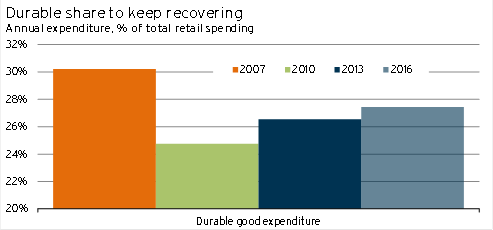
We gave a hint of this overall outlook by discussing expected sales growth in all these store-types during the next three years. However, one key way to give the growth numbers context is to ask how much of current retail spending is actually taking place on durable goods compared to where it was during more “normal” economic conditions.
Graph 5.21
Graph 5.22
The first point is that spending on durable goods is still a much smaller proportion of total spending than it was in March 2007. On the face of it, the figures imply that there is further scope for increases in durable good expenditure in excess of the increase in total retail spending.
However, there are a couple of issues that will hold the value of expenditure back from returning to its prior peaks. Firstly, the peak level of durable good expenditure was due to significant borrowing and highly elevated consumer demand, a situation that is unlikely to be repeated in the coming years given changes to financial markets and the memory of the Global Financial Crisis.
Secondly, the relative price of durables to non-durables has fallen since 2007, implying that households do not need to spend as much of their household budget on durable goods to receive the same level of durable good services. Even though we expect this trend in relative prices to moderate, due to the changing focus of China as discussed in Asian rebalancing: good, or a necessary evil?, durables will to remain relatively cheap compared to history.
Risks from LVR restrictions
Spending on durable goods is “credit sensitive”. This sensitivity is because you generally pay for the good upfront, but receive a stream of services through time (such as washing your clothes, or watching your TV). So it is possible to put off replacing durable good products when economic conditions get tough. As a result, when it is harder to borrow, or when households become less willing to borrow, these big-ticket items will not be financed.
This factor was part of the reason why durable good expenditure dropped so heavily during 2009. At present, our forecasts presume that loan-to-value ratio (LVR) limits will not place a binding constraint on durable goods sales, outside of the effects on house prices, sales, and building activity. As a result, the introduction of these regulations poses a significant downside risk to our forecast for durable good retailing in the near term.
The credit-sensitive nature of expenditure on durable goods also implies that purchases of these goods is the type of spending that may be delayed or cut back following the introduction of LVR limits on mortgage borrowing.