Third time lucky? LVRs set to slash house sales by at least 15%
The Reserve Bank’s recent announcement of new loan-to-value restrictions that it plans to implement from the start of September caught us a little by surprise – not the idea itself, because that was pretty well telegraphed, but the magnitude of the latest changes. We’ve spent some time analysing the mortgage lending data and believe that these changes could have the biggest effect on housing market activity of any of the Bank’s moves since 2013. This article presents our analysis of the potential effects of the upcoming LVR changes in September, as well as providing our estimates of the effects of the previous two sets of LVR restrictions in 2013 and 2015.
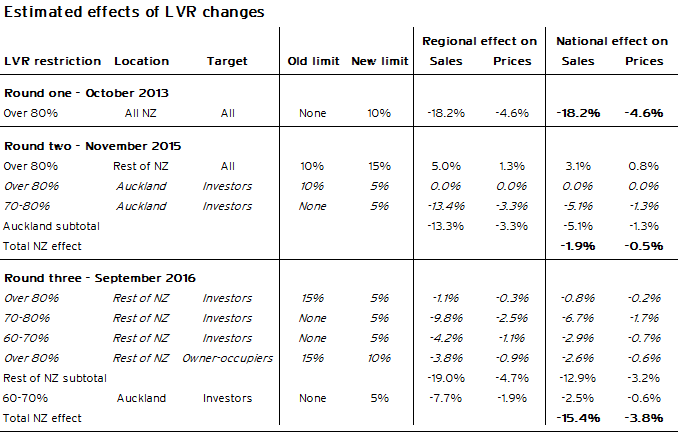
Our full estimates of the effects of the three sets of LVR changes on house sales and house prices are contained in Table 2 at the end of this article.
Round three: damn those investors
Dissatisfied with its failure thus far to slow the Auckland housing market and quell apparently speculative behaviour by investors, the Reserve Bank has announced it intends to implement further LVR restrictions in September this year. The Bank also appears, for now, to have given up on the idea of targeting Auckland specifically, and intends to return to a single nationwide policy.
The key points of the proposed changes in a month's’ time are:
- an increase in deposit requirements for investors buying property in Auckland, with the maximum LVR reduced from 70% to 60%, and no more than 5% of lending to investors failing to meet this criterion
- a reduction in the proportion of lending that can be made to owner-occupiers outside Auckland with an LVR of over 80%, with the ceiling being brought down from 15% to 10% of lending
- the standardisation of lending rules for investors in Auckland and around the rest of the country – previously investors outside Auckland had been subject to the less stringent lending requirements faced by owner-occupiers.
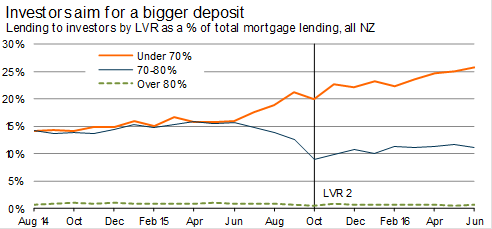
The biggest effects of the proposed changes will be on investor demand outside Auckland. Over the last eight months, an average of 37% of lending to investors outside Auckland has been with an LVR of over 70%. Furthermore, the Reserve Bank’s estimates suggest that 35% of lending to investors nationally has an LVR of between 60% and 70%. In other words, as much as 72% of investor borrowing outside Auckland could be affected by the proposal to eliminate lending to investors with an LVR of more than 60%.
Graph 1
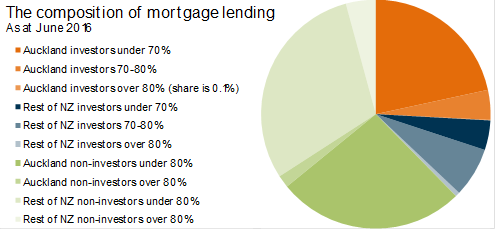
However, the Auckland experience shows that a relatively large proportion of investor lending is able to be exempted from the restrictions. Since the LVR restrictions for investors were introduced last November, an average of 13% of lending to investors in Auckland has had an LVR of over 70%. This relatively high figure is due to the “combined collateral” exemption, whereby an investor might have a high-LVR loan tied to their investment property (which makes sense for tax purposes), offset by a high degree of equity in other property (eg their family home or, because the policy was regionally targeted, in investment properties in other parts of the country).
The effects of the upcoming changes in September
As the LVR restrictions become tighter, there is less ability for investors to use combined collateral to get around the LVR requirements. From later this year, investors getting a new mortgage will need to have 40% equity in investment properties across the country (rather than, previously, 30% in Auckland and 20% across the rest of the country), which will enable less “shuffling” of equity between properties. And the 60% LVR ceiling will mean that, all other things being equal, fewer investment properties can have a “deposit” financed using equity from the family home than under the current regulations.
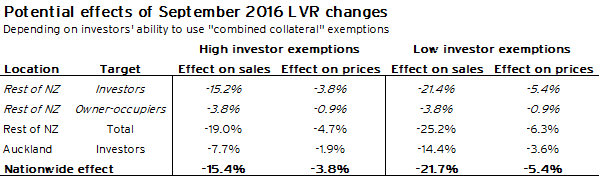
Table 1 shows our estimates of the potential effects of the upcoming LVR changes on housing market activity. The tighter LVR restrictions for investors could result in a fall in house sales volumes in Auckland of between 7.7% and 14% in sales in Auckland, and a drop in sales outside Auckland of 15-21%. The reduction in high-LVR lending for owner-occupiers outside Auckland would also contribute a 3.8% reduction in sales.
Overall, these results add up to a fall of between 15% and 22% in sales activity nationally.
Table 1
How did we get calculate our estimates?
Our estimates based on high investor exemptions assume that exemptions for investors with an LVR of over 60% continue at the same level as exemptions for Auckland investors with an LVR of over 70% since the most recent changes in November 2015.
The other end of our estimated range assumes that, going forward the proportion of high-LVR lending to investors both within and outside Auckland comes in below the Reserve Bank’s ceiling by a similar amount as current lending to owner-occupiers . For example, an average of 8.0% of lending to owner-occupiers in Auckland over the last eight months has been to people with an LVR of over 80%, which is two percentage points below the 10% ceiling. So we have assumed that investors with an LVR of between 60% and 70% will make up just 3.0% of lending to investors in Auckland (ie two percentage points below the 5.0% ceiling).
Similarly, around the rest of the country, an average of 13.5% of lending to owner-occupiers over the last eight months has been to people with an LVR of over 80%, which is 1.5 percentage points below the current 15% ceiling. So we have assumed that investors with an LVR of over 60% will make up just 3.5% of lending to investors outside Auckland (ie 1.5 percentage points below the 5.0% ceiling). The slight difference of an assumed 3.0% of lending in Auckland and 3.5% of lending around the rest of the country does not make much difference to the final outcomes, and reflects that collateral exemptions may be slightly more easy to achieve for investment property outside Auckland, which will generally be cheaper than purchasing property in Auckland.
Which of these outcomes is more likely?
In our view, the effects of the upcoming changes are likely to be closer to the first (less significant) set of estimates. Although investors will have less scope to use the combined collateral exemption, we expect that most investors will still have considerable scope to rearrange their financial affairs to get around the new restrictions.
Nevertheless, it is clear that the effects of October’s proposed changes on the housing market will be significant, with the decline in sales and slowdown in price growth likely to be of a similar magnitude to the results of the initial LVR restrictions implemented in late 2013.
Background: effects of the previous LVR moves
The remainder of this article provides background on the estimated effects of the first two sets of LVR restrictions implemented in October 2013 and November 2015. Understanding the magnitude of the effects of these policy changes helps provide a better frame of reference for understanding how housing market activity is likely to evolve later this year when the latest set of restrictions is introduced.
Round one: experimenting with the unknown
Back in 2013, Reserve Bank Assistant Governor John McDermott presented some back-of-the-envelope estimates about what effect the upcoming LVR restrictions could have on the housing market. His guess was that about 20% of mortgage lending was to borrowers with a deposit of less than 20%, and that share would drop to 10% when the new restrictions came into force1 . On that basis, he estimated that about 10% of house sales would be affected (or, at the most extreme outcome, prevented from taking place), with a flow-on effect of knocking 2.5 percentage points off house price inflation.
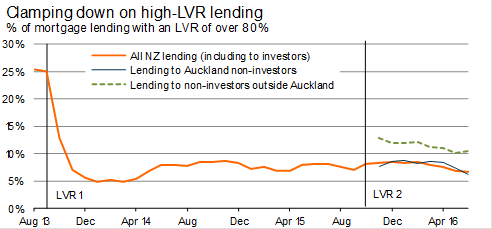
As it turned out, the effect of the first set of LVR restrictions on the housing market was bigger than those estimates. Data subsequently released by the Reserve Bank showed that high-LVR mortgages made up 25% of new lending in August and September 2013 before the new restrictions came into place (see Graph 2). And the retail banks took a very cautious approach to making sure they came in under the Reserve Bank’s ceiling – high-LVR’s share of total lending got as low as 4.8% in January 2014. Our estimates now suggest that house sales volumes were knocked down by over 18% over the following 9-12 months – a figure that lines up with the 15% drop in seasonally adjusted sales volumes between the September 2013 and June 2014 quarters.
Graph 2
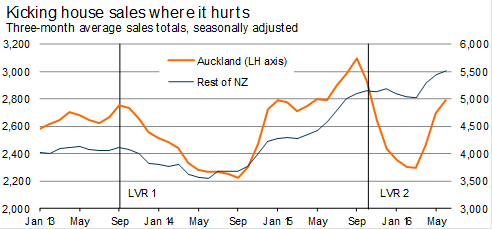
Auckland was hit harder by the changes, an expected result given that housing in the city is more expensive than the rest of the country. However, the difference in the drop in sales in Auckland and around the rest of the country was surprisingly small (see Graph 3), and the same was true of the slowdown in house price inflation (see Graph 4).
Graph 3
Graph 4
Round two: focusing in on Auckland
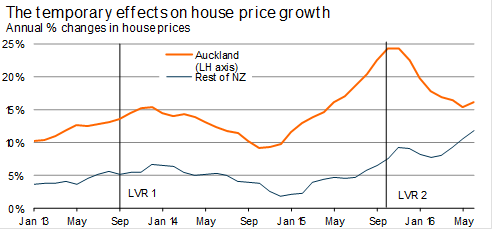
By late 2014, the housing market was regaining momentum, confirming our view that the effects of the LVR restrictions in slowing the market would be only temporary. The most galling aspect for politicians and officials was that it was the highly priced Auckland market that was leading the resurgence. By May 2015, house price inflation in Auckland was running at 16%pa (faster than it had been in 2013).
This outcome prompted a more focused attack on Auckland. From November 2015, virtually all investors buying property in Auckland would need to stump up with a 30% deposit.2 The 10% ceiling for owner-occupiers would remain in place in Auckland but, in recognition that other regional housing markets did not pose the same financial stability risks as the Auckland market, outside Auckland, the ceiling was lifted to 15% (across all borrowers).
Our modelling suggests that sales volumes outside Auckland should have increased by 5.0% as the LVR restrictions were eased, with the tighter investor restrictions within Auckland leading to a 13% drop in sales volumes in the region. Seasonally adjusted sales data actually shows a 26% decline in activity in Auckland between the September 2015 and March 2016 quarters. The larger magnitude of this shift probably reflects the change in capital gains rules that came into place in October last year, which resulted in investors bringing property purchases forward ahead of the change in rules, thereby putting additional upward pressure on sales volumes in the September 2015 quarter.
Graph 5
Around the rest of the country, there was a modest 1.5% decline in house sales volumes over the same six-month period. The divergent trend lines up with what we would expect given the difference in policy directions between Auckland and the rest of New Zealand.
This divergence was also evident in house price growth. Between November 2015 and May 2016, house price inflation in Auckland slowed by nine percentage points, from 24% to 15%pa. Around the rest of the country, house price inflation accelerated (after a brief wobble between November 2015 and February 2016), lifting from 9.2% to 11%pa.
In conclusion
The effects of the upcoming LVR changes look likely to be of a similar magnitude to the first round of restrictions introduced in 2013, hitting sales volumes nationally by 15-22% and slowing house price inflation by around 4-5 percentage points. Nevertheless, we believe that the effects of the upcoming LVR changes will again be temporary. In Auckland, in particular, the demand and supply equation remains profoundly out of balance, and further significant and sustained increases in residential building activity are necessary before house price inflation can be brought under control.
The housing market outside Auckland does not have the same undersupply issues and so is less resilient to changes in policy settings or other external shocks, but underlying fundamental drivers such as population growth and mortgage rates remain very favourable for strong housing market activity once the effects of the upcoming LVR changes have worked their way through the system.
Table 2
1 The restrictions required that no more than 10% of banks’ mortgage lending be to borrowers with an LVR of over 80%. However, there were some exemptions from this calculation that meant total high-LVR lending could end up being 10% or higher. Exempted lending categories include lending made under Housing NZ’s Welcome Home Loans scheme, refinancing of an existing high-LVR loan, bridging finance, or the “porting” of a high-LVR loan between properties. Since the LVR restrictions were first introduced in October 2013, some other loan types have subsequently been added to the exempted lending category.
2 The Reserve Bank allowed for 5% of lending to investors in Auckland to have an LVR of over 70%, rather than no lending at all, to allow some margin for bank error.