What has happened with household debt?
New Zealand households owe a lot of money, but they also own a lot in terms of assets. In this article we briefly outline why debt has increased, and why we believe households will still be willing and able to borrow over the next few years.
With export commodity prices falling sharply we expect household income growth to slow in the coming years. However, given that part of the current decline in export prices is only expected to be temporary – with prices recovering somewhat in the longer term – the overall effect on consumer spending should be reasonably minimal.
We discuss the varying factors influencing dairy prices, and the regional effects, in Assessing the effect of lower milk prices on regional dairy payouts. However, in this article we are focusing on the effect on broad national spending. Although lower dairy prices do have an effect on consumer spending in our forecasts, we still have the value of spending growing by 5.4%pa between March 2015 and March 2017 and the volume of consumption rising by 2.2%pa. Growth in the value of spending is much stronger than for nominal incomes, which grow at only 4.0%pa, due in part to the drop in dairy prices.
The logic behind such an economic forecast is as follows: a temporarily lower terms of trade will reduce incomes now, but also implies that incomes will recover in the future. If households and firms are sufficiently confident of a future rebound, are sufficiently willing to take on risk, and are sufficiently able to borrow, they will increase borrowing now to continue funding consumption and investment. Effectively, households and businesses will borrow some of their future higher income to smooth consumption and investment through a short tough patch.
However, if any of the three conditions above are not met, households will not lift borrowing as much as we are forecasting, and the slowdown in domestic consumption will be a lot sharper.
When putting together these forecasts, we have relied on the view given above regarding how households will respond to this temporary dip in income growth.
Let’s flesh out the specific risks. The sharp, temporary, decline in the terms of trade, and corresponding slowdown in employment growth, is a situation where household income growth will be expected to cool temporarily. As a result of the temporary nature of the drop in income growth, we would normally expect households to cut consumption slightly, but to also increase borrowing. Although we have stuck to this assumption, the current high level of gross debt held by households makes this assumption seem both strong and critical because, following the Global Financial Crisis:
- households may still feel particularly averse to borrowing
- retail banks may be particularly picky with their willingness to extend credit to households.
One of the purposes of this article is to outline that New Zealand households’ position remains strong enough to justify additional borrowing, and to reinforce that if this strong position wasn’t the case, then consumption growth would cool more sharply than we’ve allowed for in our forecasts.
A rising debt burden, a rising asset position
In terms of overall debt, the data on New Zealand’s history has not changed significantly since our March article on New Zealand’s international investment position1 (although it has been revised). Overall, New Zealand liabilities to the rest of the world are still large, but are significantly smaller, relative to income, than they were five years ago.
However, when it comes to considering whether households will be willing to borrow, and whether someone will be willing to lend to households, it is more relevant to look at household data – rather than data for the country as a whole.
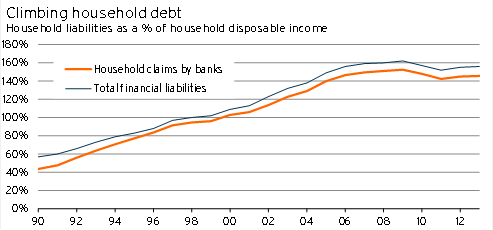
Between 1990 and 2008 there was a significant increase in households’ gross debt burden relative to the disposable income earned by households. With the population aging during this period, we would have expected, all other things being equal, that gross debt would have been more likely to decline – making the sharp increase all the more surprising.
Up until the Global Financial Crisis, the increase in gross debt was said to be based on four separate factors.
- Improving efficiency in the financial sector, which made it easier, less risky, and cheaper for households to borrow
- A lower level of government debt, which made foreign funds easier for households to access
- Improving labour market conditions, which convinced households it was safer to borrow
- Rising asset prices – especially housing
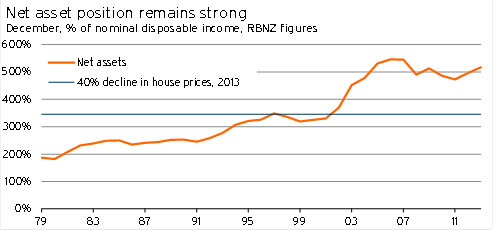
The last factor was especially prevalent in New Zealand from 2002/03 onwards. The significant increase in house prices pushed up households’ gross wealth (relative to disposable income) significantly. But when we look at the data, it shows that household borrowing during last decade’s housing boom was sufficiently restrained so that net wealth (gross wealth minus gross liabilities) rose sizably (see Graph 5.6).
Graph 5.5
Following the finance company collapses within New Zealand and the Global Financial Crisis, it became evident that there was an additional factor at play – an over-willingness of creditors to take on risk, given their expectation that they would be bailed out if something was to happen.
Graph 5.6
As financial market regulation was changed, and a recognition that governments were relatively unwilling to bail out firms was realised, the level of household borrowing has levelled off.
This high level of gross debt is a significant risk – both for the households that are indebted (and who will face real hardship if their future income is lower than they expect), and for the banks that have lent money to households (and who will experience a loss if the household is forced to default). As a result, such a high level of gross debt is the key reason why households may be unwilling to borrow, and why banks may be unwilling to lend to them.
However, simply looking at gross debt ignores the asset side of the equation. Households’ net wealth remains highly elevated. As Graph 5.6 indicates it would take a 40% decline in house prices for net wealth (relative to disposable income) to fall back to where it was in the mid to late 1990s. Given that net wealth already factors in current borrowings, this all implies that there is ample scope (if both creditors and households are willing to take on the risk) for increased future household borrowing.
If both banks and households view a slowdown in household income growth as temporary, a short-term surge in borrowing based on the fact that households as a whole have a very strong net wealth position remains reasonable.
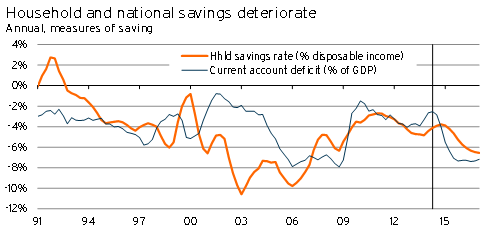
It is only because the net wealth of households is still so high by historic standards, and expected to remain high during our forecast horizon, that we are willing to allow our model to introduce the level of household borrowing shown in Graph 5.7.
What about household expectations? We believe that many of the households whose incomes are most heavily influenced by lower export prices (eg, farmers or workers in provincial communities) will recognise why income growth has slowed. Furthermore, we believe that there is a general expectation in these communities that dairy prices will recover, albeit not to the very high levels seen last season. As a result, these household types are more likely to recognise that this hit to income is a temporary blip – justifying the households’ decision to borrow.
Summing up, we have assumed that households will be willing and able to borrow over the next three years – as they anticipate that slower income growth is only temporary, and they are both willing and able to borrow due to their very attractive net wealth position.
Graph 5.7
If any of these three assumptions fail (households’ expectations, households’ willingness to borrow, and household’s ability to borrow), then the current sharp drop in export prices can be expected to lead to a much more severe slowdown in consumer spending than we have in our central forecasts.