What’s really going on with tourism in regional New Zealand?
Although the number of overseas visitor arrivals to New Zealand has risen to well above its pre-Global Financial Crisis level, many tourism operators in regional New Zealand are continuing to experience subdued business conditions. Using Infometrics’ regional tourism GDP dataset, we examine this assertion in more detail at a territorial authority (TA) level. Our results show that tourist operators’ complaints aren’t just idle whinging – changing international visitors’ travel patterns are having a profound effect on tourism activity in some of New Zealand’s regions.
International visitor arrivals in the year to March 2013 totalled 2.61 million, compared to less than 2.50 million in the year to March 2008. At a national level, these climbing numbers of foreign visitors, coupled with rising levels of domestic tourism, saw the tourism industry’s real contribution to economic activity increase by 4.4% over the five years to March 2013.
At face value this result appears rosy, however, growth in tourism GDP over this five year period has lagged growth in the broader economy (up 5.2%). Furthermore, gains in tourism GDP have been spread unevenly throughout New Zealand. Infometrics’ tourism GDP dataset shows that 37 TAs have tourism sectors that grew in real terms over the past five years, while tourism GDP in the other 29 TAs declined. The remainder of this article will dissect the factors behind this regional divergence.
A different type of tourist
The key factor behind this regional tourism divergence is related to the dramatic change in the composition of where international visitors have been arriving from over recent years. Visitors from places such as China and Australia have surged, while arrivals from traditionally important markets such as the UK (and other parts of Europe) and the US have fallen.
Rising visitor arrivals from Australia and China have been driven by sharp increases to household wealth and increasing numbers of New Zealand residents with family linkages to Australia and China. On the other hand, visitor arrivals from the US and UK have fallen significantly in the wake of the Global Financial Crisis, as lingering concerns regarding economic stability weigh on people’s willingness to embark on expensive long-haul travel to destinations like New Zealand.
Visitors from these major markets stay for vastly different periods of time on average. The median length of stay for Australians (7 days) and Chinese (4 days) is far less than for visitors from the UK (20 days) and the US (9 days). The increasing prevalence of these shorter-staying visitors has left the typical foreign tourist to New Zealand with less time to visit more remote parts of the country. As a result, foreign tourist activity has become more concentrated on certain regions.
However, fortunately for the tourism sector, not all activity is generated by foreign tourists. Statistics New Zealand estimates show that just under 60% of total tourism expenditure is generated by domestic tourism and that spending by domestic tourists over the past five years has risen at a faster rate than foreign tourists’ spending.
New Zealanders propensity to travel domestically (and internationally) has continued to rise over recent years, despite challenging economic conditions. A key driver of this increased domestic travel demand has been favourable domestic airfares in the wake of intense price competition on main-trunk routes. These rising levels of domestic tourism activity have helped offset some of the downside for regions that have suffered from lower levels of international visitors.
Measuring these trends at a territorial authority level
Of course, it’s all very well to discuss these trends, but in order to robustly assess what has happened to each TA’s tourism industry we need a more quantitative framework. This goal can be achieved by looking at two factors – tourism GDP and each TA’s exposure to tourism relative to the national average.
Tourism GDP estimates for each TA were taken directly from Infometrics’ regional dataset, while each TA’s tourism exposure was calculated using a scaled index of the size of that TA’s tourism industry (as a percentage of total GDP) relative to the size of the tourism industry in the national economy (as a percentage of total GDP).
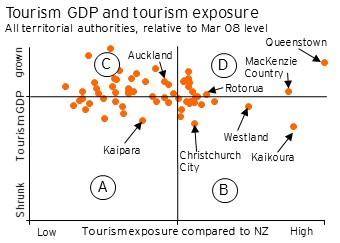
We then marked these measures for every TA on a scatter chart (see graph). The vertical axis shows whether tourism GDP has grown or shrunk relative to its March 2008 level, while the horizontal axis denotes whether the TA has a higher or lower exposure to tourism than the national average. To isolate groups of TAs, the scatter chart was divided into four quadrants (A, B, C, and D). The borders of these four quadrants coincide with whether or not each indicator is above or below its base level.
Quadrants A and B contain 29 TAs whose tourism industries generated less economic activity over the March 2013 year than they did during the March 2008 year. Dissecting these two quadrants of struggling TAs further shows that 15 of them have a low exposure to the tourism industry (shown in quadrant A), while the other 14 TAs are more highly exposed to tourism (shown in quadrant B).
The poor performance of TAs in quadrant A is of relatively little concern, as these poor performances affect only a relatively small cross-section of economic units. The tourism industry in these TAs generated on average 2.0% of GDP over the year to March 2013, compared with the 3.7% of the national economy which is exposed to tourism. The majority of TAs in quadrant A are small districts in the North Island.
The poor performance of TAs in quadrant B is more concerning, as these TAs are highly exposed to the tourism industry. The tourism industry generated on average 5.7% of GDP in these TAs over the past year. TAs in quadrant B include parts of the central and eastern North Island, as well as Nelson, the West Coast, Kaikoura, Christchurch City, and Southland.
The fact that TAs in quadrant B have struggled is unsurprising given these districts’ high exposure to international tourists and, apart from Christchurch City, their relative isolation from main-trunk airports. Fewer long staying tourist in New Zealand over the past five years have meant that many of these slightly off-the-beaten-track destinations have been cut from itineraries. The Canterbury earthquakes have also supressed tourism activity in many parts of the South Island.
Quadrants C and D contain 37 TAs whose tourism industries generated more economic activity over the March 2013 year than they did during the March 2008 year. Dissecting these two quadrants of top performing TAs further shows that 25 of them have a low exposure to the tourism industry (shown in quadrant C), while the other 12 TAs are more highly exposed to tourism (shown in quadrant D).
On average, TAs in quadrant C only have 2.4% of their economies directly exposed to the tourism industry. TAs in this quadrant include Auckland, most of Waikato, parts of Taranaki, the Wellington region, and Canterbury districts surrounding Christchurch City. The key driver of growth in many of these regions has been rising levels of domestic tourism, as New Zealanders take advantage of favourable domestic airfares to sneak a weekend getaway, while heightened stress and the destruction of infrastructure in Christchurch City boosted visitor levels to communities in neighbouring districts. Auckland, home to our busiest international airport, also benefited from rising foreign visitor arrivals because almost all tourists to New Zealand spent at least a night or two in Auckland on their way through.
The positive performance of TAs in quadrant D has been particularly pleasing for these districts given their high levels of exposure to the tourism industry. The tourism industry in these TAs generated on average 7.3% of GDP over the past year. TAs in quadrant D include the Coromandel, Tauranga, Rotorua, Tasman, Marlborough, Hurunui (Hamner Springs), Mackenzie Country, and most of Otago.
The star performer in quadrant D was Queenstown, with the district’s tourism industry growing by a quarter over the past five years. A sharp lift in the number of Australians visiting the region, as well as vastly improved domestic flight frequency, has been behind this lift. Rotorua was one of the poorest performing members of quadrant D, with the district’s tourism industry virtually flat-lining over the past five years. Although Rotorua is firmly on the Chinese tour circuit, the district has lost out as visitors from longer-staying nations cut back. Furthermore, despite some Chinese tour groups overnighting in Rotorua, some tours simply make the day trip from Auckland.
Considering the future
When looking to the future of their industry, those exposed to the tourism industry need to bear in mind that the decline in arrivals from longer-staying nations is due to a prolonged trough in developed nations’ economic cycles, while the lift in arrivals from Australia and China is more of a permanent structural shift. The risks and opportunities posed by these two factors for tourism in regional New Zealand are quite distinct and planning must take account of these differences.
Visitor numbers from longer-staying nations will eventually recover – even if this recovery takes a number of years. At least in the meantime, those operators who have weathered the storm to date are leaner and more efficient than they were before the downturn and will be well poised to capture any pick-up.
At the same time, stakeholders in the tourism industry must not ignore the important role which domestic visitors play in nurturing tourism in regional New Zealand. With recent economic indicators continuing to point towards a broad-based pick up in the New Zealand economy, kiwis’ willingness to spend on discretionary items such as travel will grow significantly over the coming years. Although some of this additional travel will be to overseas destinations, tourism operators in regional New Zealand still stand well poised to capture some of this uplift.