More people per household: what does it mean for construction trends?
This article first appeared in Mitre 10 Trade Quarterly – Spring 2017.
The number of people per household has generally increased since 2008, despite the aging population and shrinking family sizes suggesting that it should be falling, it has increased throughout most of the last eight years. But the rising occupancy rate might not be that remarkable when we consider economic and property market conditions. The Global Financial Crisis dented people’s wealth and incomes as asset prices fell sharply and unemployment rose. And even with the New Zealand economy performing well over the last four years, soaring property prices have meant that housing costs have outpaced income growth. Resulting affordability problems have meant that young people are staying with their parents for longer, people are taking on boarders or flatmates to help pay the mortgage, or people are living in multi-family households.
Graph 1

Surprisingly, if we look at the data on a regional basis, there is no consistent correlation between worsening housing affordability and upward pressure on occupancy rates. In the high-profile Auckland region, the theory stacks up. But other areas, such as Thames-Coromandel and Taupō, have had rising occupancy rates alongside improving affordability. Perhaps other factors, such as socio-cultural preferences, also play a role.
We won’t get a good understanding of changes in the composition of New Zealand households until data from the next census is published in late 2018 or 2019. But in Auckland, where high land and housing costs are having a definite effect on people’s decision-making, the ramifications of the possible changes are particularly interesting.
Our graph shows that the average size of new dwellings in Auckland over the last year is the smallest since 2006. The size of new standalone houses in the region has been fairly steady since 2007. But the increasing share of attached dwellings, as intensification takes place, has driven down the overall figure.
Graph 2

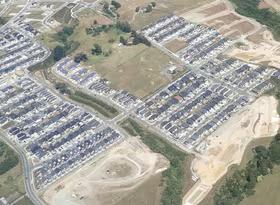
The consent trends in Auckland highlight a dichotomy in the way we can react to reduced housing affordability. One response is to build denser types of housing (ie townhouses, flats, and apartments) that require less land per dwelling. This response is logical given that, in Auckland, land can be the most expensive component of the building process. The graph shows that these attached dwellings are typically significantly smaller than standalone houses.
The second possible response, for which Auckland and Queenstown are prime candidates, is to build larger dwellings to cater to bigger household sizes. Mitigating high housing costs by having space for boarders or extended family means that the extra rooms and floor area of large new houses could be more fully utilised than if the household was made up of the standard nuclear family.
Projections from Statistics NZ show that Pasifika and Asian ethnicities are expected to be the fastest growing groupings within New Zealand’s population, and that this growth will be most heavily concentrated in Auckland. People from these cultural backgrounds are more likely to live in extended family arrangements than your average Pākeha family.
Graph 3

Auckland is entering a period of significant transition. Densification in the city is taking front and centre stage, but keep an eye on the potential growth in demand for new houses that can cater to multi-family or extended family living arrangements.
Across the rest of the country, where housing affordability is generally not as critical as in Auckland, we might see shrinking section sizes and very gradual increases in townhouse and apartment building in the largest urban centres. But we don’t expect to see the major changes in residential construction trends we see in Auckland.


