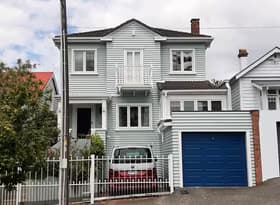
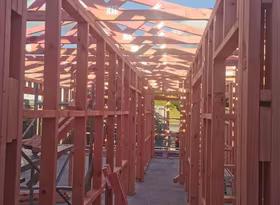
The future pipeline of residential building
New dwelling consent numbers are on the verge of topping 50,000pa for the first time on record, with the annual total just 1,101 consents shy of this milestone in December. The 24%pa growth during 2021 is phenomenal when one considers that consent numbers were already at a 46-year high of over 39,000pa heading into the year. As conditions start to become less favourable for residential construction, is this pipeline of work all its cracked up to be?
Everything points towards it taking longer to build
Code compliance certificate (CCC) data from Auckland Council shows that there were 13,577 CCCs issued in the region in the year to October 2021. This figure represents about 91% of the number of Auckland’s new dwelling consent numbers from two years earlier. As Chart 1 shows, a two-year gap between the two data series is about normal.1 We also note the effects of the lockdowns in 2020 and 2021, which have delayed projects and appear to have temporarily widened the time gap between consent and CCC.
Stats NZ did some work in 2017 examining the lag between consent and completion. Stats NZ’s analysis suggested that:
- unsurprisingly, the lag between consent and completion extended out during periods of strong building activity
- it also took longer for the lag to start shrinking after consents fell away – presumably as the backlog of building projects had to be worked through
- the average lag in the 2010s was longer than in the 1990s, presumably due to much greater regulatory oversight of building projects following the leaky homes crisis in the 1990s and first half of the 2000s.
Evidence for the latter point is a little thin. However, Chart 2 shows that New Zealand approved over 25,000 consents in 1997 and had an average build lag of six months in 1998. In contrast, the average build lag wasn’t less than nine months in the 2010s, despite consent numbers getting below 14,000pa in 2011, suggesting a lot more red tape or a big drop in productivity.
Stats NZ’s estimates stopped in 2016, with a 10-month lag based on 27,132 consents approved in 2015. With consent numbers now getting close to double that number, it also wouldn’t be surprising if the average lag is now pushing over 18 months.
It’s also worth noting that the current mix of new dwellings is likely to be contributing to an extended lag to completion. Chart 3 shows that attached dwellings made up a record 48% of new dwellings last year, having held between 15% and 32% between 1978 and 2016. The “townhouses, flats, units, and other dwellings” category, which made up 70% of all attached dwelling consents last year, covers a wide range of dwelling types, so it is hard to be definitive about the lags. At one extreme, a townhouse with two units is unlikely to have a construction timeline that is much longer than the timeline for a standalone house. However, there is likely to be a lot of larger projects within this category that are contributing to the extended construction timeline for an average new dwelling.
Longer lags mean that overbuilding is still some time away
If we take Auckland’s two-year lag between consents and CCCs as a rough indication of completions across the country, then the current rate of new homes being added to the dwelling stock would be about 37,600pa – reflecting the annual consent total at the end of 2019. Although we always treat Stats NZ’s dwelling stock estimates with caution, this consent figure from two years ago is fairly close to the estimated increase of 36,400 in the total dwelling stock during 2021.
But we haven’t yet addressed the housing shortage. Commentators pointing to our current consent total of 48,900pa and talking about how much we are now oversupplying the market with new dwellings are overstating the situation. Yes, the border closures have dragged population growth down to a nine-year low of 0.5%pa and thus reduced our current estimate of underlying demand for new dwellings by 19,000pa compared with three years ago. But we estimate that underlying demand in the March 2022 year will still be about 29,400 new dwellings. In other words, as Chart 4 shows, we’re probably “overbuilding” by about 8,200 dwellings, rather than the 19,500 implied by current consent numbers.
It’s also worth reiterating the amount of underbuilding that has occurred over previous years and the extent of catch-up that is required. During the second half of last decade, the failure of residential construction activity to keep pace with population growth saw significant underbuilding of somewhere between 32,000 and 70,000 dwellings. Even with current consent numbers, given the lags between consent and completion, it could be 2024 before that previous underbuilding is rectified.
We also note that the estimated number of people per household, at 2.70 in September 2021, remains about 6-7% higher than we think would prevail if housing was more affordable. In other words, underlying demand for housing has been constrained by the lack of affordable housing, which has forced people into larger flatting situations, to take on boarders, to live with other families, or to continue living with their parents. We do not expect this latent demand to suddenly reappear without a significant improvement in housing affordability. However, this point highlights that undersupply, rather than oversupply, remains the predominant risk with the housing market at the moment.
It also demonstrates the difficulties in being unequivocal about the extent of any oversupply or undersupply with a model based on observed dwelling and household outcomes. Our model of underlying demand is based on an assumption that any fluctuations in occupancy or vacancy rates caused by an oversupply or undersupply of housing will be rectified by the market within a nine-year timeframe, which historically had been more than enough time to capture a complete cycle for the housing or residential construction markets. However, this housing market boom has been running for 11 years, and the deviation between expected2 and actual outcomes for the occupancy rate has got continually wider between 2008 and 2020 (see Chart 5).
Soaring costs and falling house prices pose risks to the pipeline
One of our biggest concerns about the future supply of new housing is the potential for the stagnating housing market to coincide with spiking building costs and undermine new developments from going ahead. Chart 6 shows the history of house price inflation and residential building cost inflation in New Zealand. Although house prices have risen, on average, significantly faster than residential building costs3 over the last 40 years, the relative movements of the two data series provide important insights into marginal demand for existing and new housing, and the attractiveness of progressing new construction for developers.
This relationship is demonstrated in Chart 7. Annual changes in the ratio of house prices to building costs (Tobin’s Q) are mapped against changes in the annual consent total (the latter being significantly more variable from year to year). House price growth is widely expected to slow from 30%pa to below 5%pa this year. At the same time, the latest CPI data shows a 4.6% quarterly lift in residential building costs, the third consecutive quarterly increase of about this magnitude, and equivalent to an annualised building cost inflation rate of over 19%. Even if building cost inflation in 2022 is less rampant than it was last year, it’s easy to envisage building costs rising faster than house prices this year. That outcome would send the Tobin’s Q ratio into negative territory and probably to its most negative for residential building since 2010.
In simple terms, a developer will feel uncomfortable about going ahead with new housing projects given the significant risks of delays and cost overruns, in an environment where static house prices mean they could struggle to sell the property at a higher price to cover any increased costs.
We have outlined a range of reasons above why we don’t expect the residential construction tap to be turned off suddenly, including the backlog of work yet to be completed and the substantial undersupply of housing that has developed during recent years. Our forecasts published last week show consent numbers holding over 50,000pa throughout 2022 before a sizable drop of 26%, to about 37,600, by the end of 2023.
But there are increasing downside risks to our dwelling consent forecasts. For example, the repercussions of the current reduction in credit availability for potential buyers could be greater than we have allowed for and cause house price falls within the next 12-24 months. A sharper housing downturn would be likely to result in a quicker drop-off in consent numbers, as well as a higher proportion of consents already in place not being translated into new dwellings.
The irony is that any earlier decline in residential construction activity would prevent the pre-existing undersupply of housing from being addressed as much as would otherwise be the case. There is a desperate need for the supply of housing and dwelling stock to be substantially increased. Regulatory changes by the government announced last year will help improve these supply issues over the medium term. But in the near term, it would seem to be in almost everyone’s interest for residential construction to continue apace. In the current environment of cost increases and high inflationary pressures, falling house prices could paradoxically prolong some of the underlying issues causing the housing affordability crisis.
1 Two years is the maximum amount of time from when a building consent is issued for the work to be completed (although extensions can be granted). Although there is no time limit for a CCC to be applied for, this two-year deadline can often be the trigger for a CCC application if it has not been done immediately after the building work was completed. So although CCCs provide a good indication of the amount of building work that has been completed, there can be a disconnect between the timing of the completion and the timing of CCCs. As a result, CCCs do not provide a definitive indication of the lags associated with building work.
2 Our expected value for the occupancy rate is based on a simple age-based demographic model. In simple terms, the increasing number of retirees and lower numbers of children per family are driving down the expected number of people per household.
3 Strictly speaking, when comparing house prices and residential building costs, the cost of building should also include section prices, because land costs are a significant part of the build new or buy existing decision. However, we do not have a reliable and up-to-date measure of section prices, so we have excluded this variable from our analysis. Nevertheless, data from 1983-2018 suggests that section prices rose even faster than house prices, implying a much smaller gap between the average growth rates of existing house prices and new home and land packages.


