New wellbeing data boosts the refreshed Regional Economic Profile
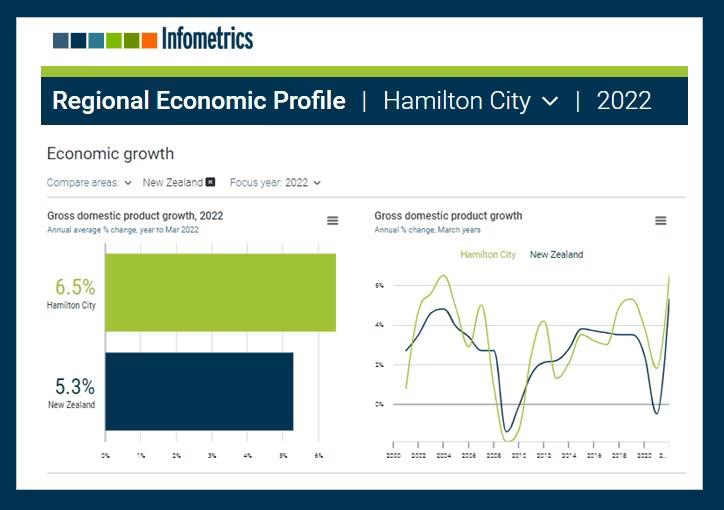
Infometrics is proud to announce that the Regional Economic Profile (REP) has been refreshed with a new look, improved functionality, new wellbeing data, and many new charts and tables. The REP provides in-depth economic insights into every region and territorial authority in New Zealand.
Data for 2023 will be added to the REP in the normal update cycle early next year.
The Hamilton City REP is publicly available, courtesy of Hamilton City Council.
New data gives a deeper insight into the Wellbeing of regions
The Wellbeing module is now accessible on the publicly available REPs. The Wellbeing module has been fully updated with data (where available) to 2022 and time series back to 2017. It presents 30 outcomes-based indicators arranged into nine wellbeing domains which align with those used in the Treasury Living Standards Framework.
This month's Chart of the Month, published in the June newsletter, shows how Masterton’s relative wellbeing outcomes have improved over the past six years.
Working with our clients to make REPs publicly available
Many of our subscription clients have kindly made their economic profiles available to the public. Profiles for 11 regional council areas, 43 territorial authorities, 21 local boards and a huge number of sub-districts are publicly available.
To see all the publicly available areas, use the area name dropdown in the header bar on one of our publicly available REPs.
More interactivity to help you benchmark your area against comparable areas
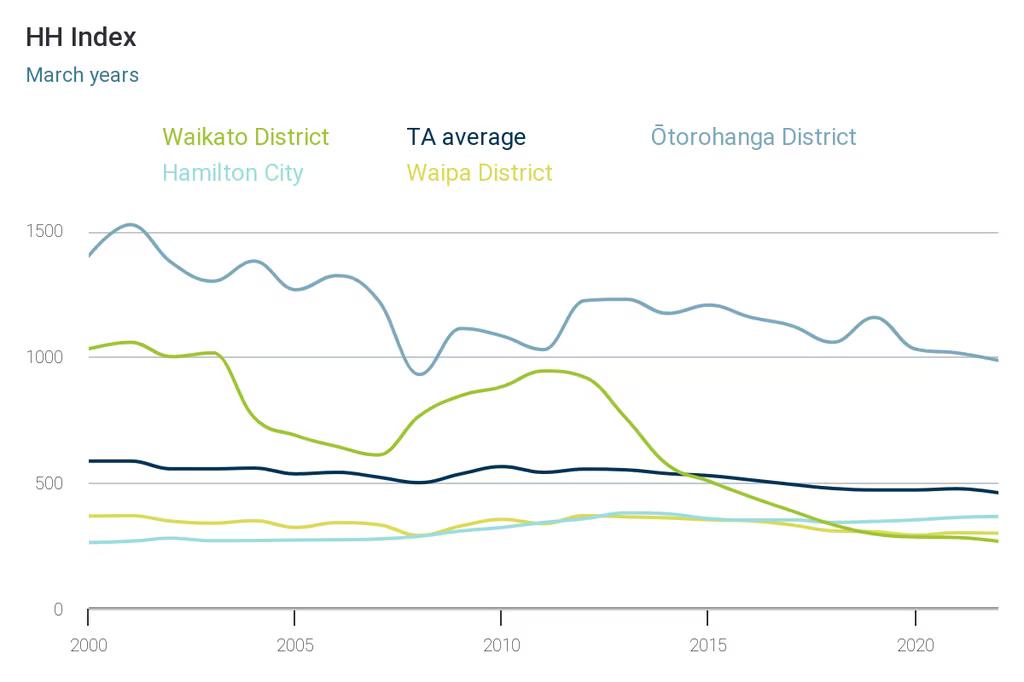
Regional clients frequently need to compare their area’s performance against other comparable areas. All our new charts and tables enable the user to choose up to four comparator areas. As an example Chart 1 shows the HH Index which measures economic diversity. It shows that Otorohanga and Waikato District have become more diverse over the past 22 years and compares this trend with other territorial authorities in the region.
Chart 1. HH Index measuring industry diversity. A lower score shows a more diverse economy
The national level profile is a free resource
Although the REP mainly focuses on regions and territorial authorities, the national level profile provides an in-depth view of the performance and structure of the New Zealand economy. It’s full of interactive graphics and tables, all downloadable, covering a wide range of topics including economic performance, exports, the labour market, tourism, living standards, and population.
Access to the New Zealand Economic Profile is publicly available:
More graphics give you deeper insights
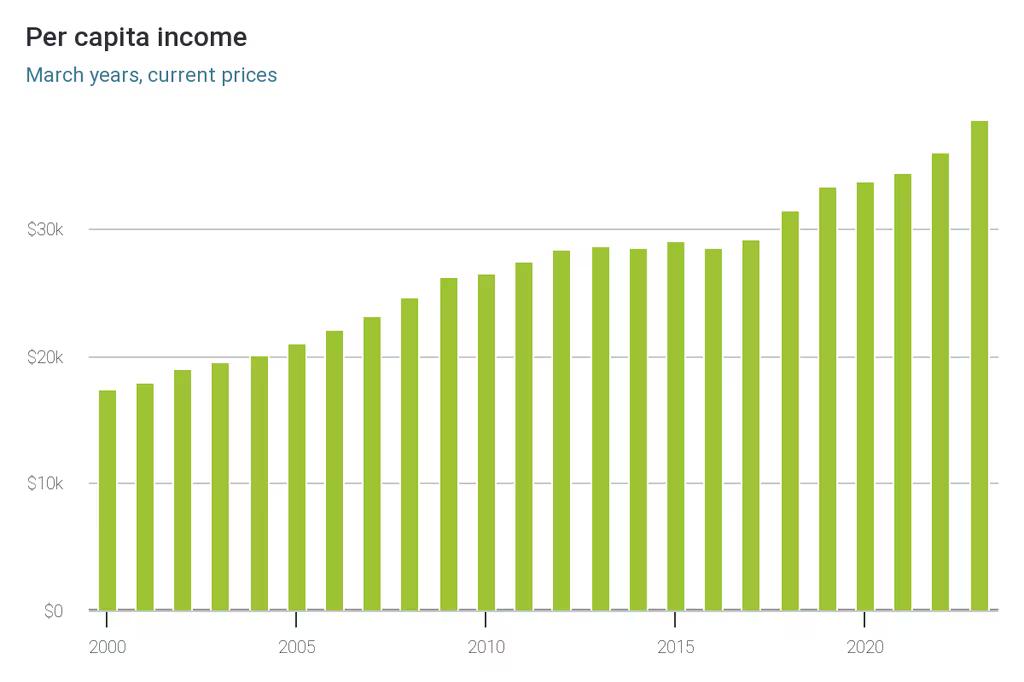
We have added many new graphics to each page to help explain your local area’s underlying economic story. We have added many level charts because they give a different perspective to a percentage growth chart. Chart 2 shows how fast per capita income in Masterton has grown, especially over the last six years.
Chart 2. Per capita income rises rapidly in Masterton
View trends at a fine geographical level
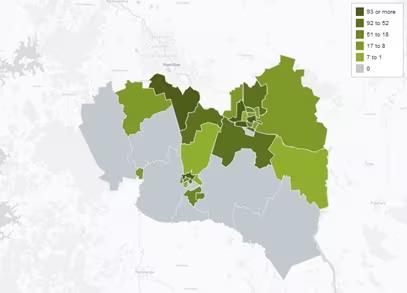
The greatly enhanced Small Areas module enables you to analyse economic, labour market and demographic trends at the SA2 level . SA2s are small geographical areas of communities that interact together socially and economically. Using new maps, tables and visualisations we show how population, GDP, employment and businesses are geographically spread across your local area and how this has changed over the past 22 years. Chart 3 shows that manufacturing output in Waipā is concentrated in its northern SA2s along its border with Hamilton City.
Chart 3. Manufacturing employment in Waipā SA2s, 2022
The small areas module is available to all Premium REP subscribers.
For more information about the REP please contact Andrew Whiteford.