Articles
- 1(current)
- 2

Earlier this month we introduced the New Zealand Index of Socioeconomic Deprivation (NZDep) to the Regional Economic Profile Census section. In this article we discuss NZDep and what it can tell us about our communities. Read

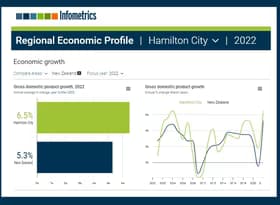
Our recent update of the Infometrics Regional Economic Profile provides us with another year of detailed data across regional economies to examine. Over the March 2024 year, our analysis shows that rural economies had the strongest economic activity growth, with the primary sector a key part of this growth story. Read

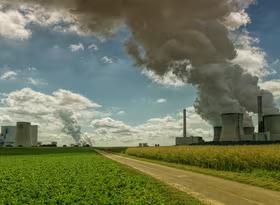
Infometrics has recently added a number of environmental indicators to the Regional Economic Profile and Quarterly Economic Monitor, including estimates of carbon emissions. This article explores how we have constructed our estimates, and what insights can be gained from our analysis. Read

The public sector is a significant employer in New Zealand, and it’s well known that these jobs are concentrated in Wellington. But how significant is the public sector as an employer around the country, and what components of the public sector drive this? Read
Infometrics has recently added a new section to our Regional Economic Profile which explores the Pacific Peoples population and their role in regional labour markets. This article outlines the growing significance of New Zealand’s Pacific Peoples population in the context of broader demographic shifts. Read
Last week Stats NZ published the latest subnational population estimates – an exciting time for those of us with a regional demographic focus. In theory, these annual population estimates should be boring – population should follow a fairly stable and predictable trend. However, our economic and demographic environment continues to be anything but boring. This article explores how New Zealand’s population growth has changed over the past year, before diving into the surprises of the subnational population estimates. Read

Drinking water quality remains a critical metric from which we can measure wellbeing in New Zealand. Access to safe drinking water is taken as given across almost all of New Zealand – for good reason. But as our Chart of the Month shows, although drinking water across most of New Zealand meets required standards, a lack of funding and measurement against some standards increases drinking water risks more than most would expect. Read
Understanding economic diversity in an economy is about analysing the diversity of ways that an economy creates economic output. A common way to do this is to look at the relative size of the industries that make up an economy. Here, we outline a framework for doing so. Read

Over the past six years Masterton’s wellbeing has improved its relative position in six out of nine wellbeing domains. In our chart of the month, we showcase the district’s movement up the wellbeing rankings using the Infometrics regional wellbeing framework available in the newly refreshed Regional Economic Profile. Read
Infometrics is proud to announce that the Regional Economic Profile (REP) has been refreshed with a new look, improved functionality, new wellbeing data, and many new charts and tables. The REP provides in-depth economic insights into every region and territorial authority in New Zealand. Read
- 1(current)
- 2