Chart of the Month: Masterton jumps up the wellbeing rankings
Over the past six years Masterton’s wellbeing has improved its relative position in six out of nine wellbeing domains. In our chart of the month, we showcase the district’s movement up the wellbeing rankings using the Infometrics regional wellbeing framework available in the newly refreshed Regional Economic Profile.
Chart 1. Wellbeing radar for Masterton District
Score out of 100 in nine wellbeing domains (higher score = higher wellbeing)
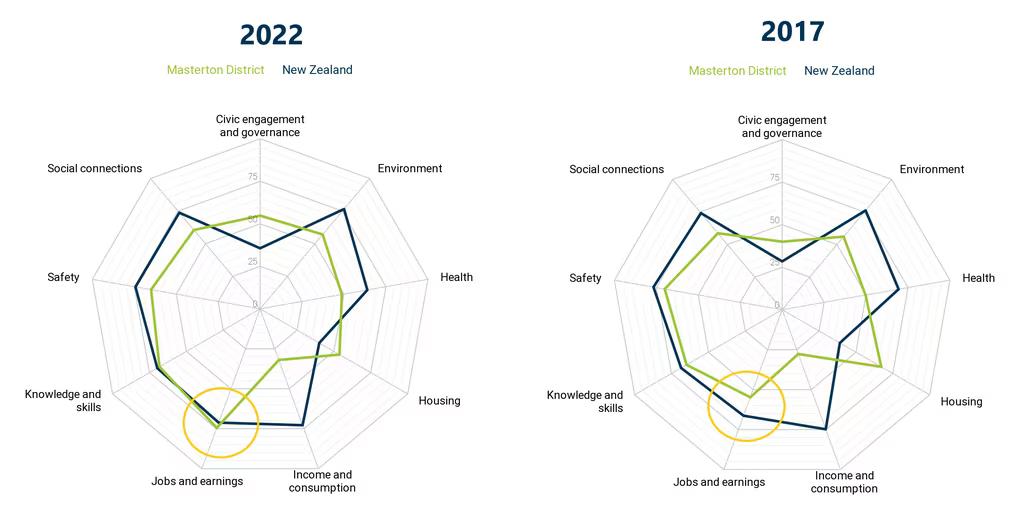
Chart 1 shows Masterton’s score out of 100 in the nine wellbeing domains and compares it with New Zealand’s scores. The measures are relative with areas with the highest wellbeing getting a score of 100 .
The largest improvement in Masterton between 2017 and 2022 is in the jobs and earnings domain (highlighted in Chart 1) which has been driven by the district’s very robust labour market. Its score out of 100 increased from 54.8 in 2017 to 74.5 in 2022 with the result that it jumped 21 places in the ranking of 66 territorial authorities. Its strong performance in this domain was driven by a declining NEET (not in employment, education or training) rate, an increasing proportion of workers in highly skilled positions, and a rapidly declining unemployment rate.
Masterton also experienced a sizeable increase in its civic engagement and governance domain score, driven by improvements in local and general election turnouts. Other domains in which Masterton moved up the ladder were income and consumption, knowledge and skills, social connections, and environment.
On the negative side Masterton’s score in the housing domain has fallen from 67.2 to 53.8, driven by housing and rental affordability decreasing faster than most districts. The district’s scores for safety and health have also dropped slightly.
Masterton’s wellbeing framework can be viewed here.