The changing pattern of future infrastructure spending
Over the next ten years, the increase in infrastructure spending in the top half of the North Island is projected to be larger than the lift in infrastructure spending nationwide. This outcome is one of the key findings of our recently launched Infrastructure Pipeline Profile. It’s perhaps no surprise that the concentration of economic activity and population growth in Auckland, Hamilton, and Tauranga is demanding more investment in infrastructure in the “golden triangle”, but the sheer dominance of increased infrastructure activity in these regions is remarkable. It also represents a significant change from the regional distribution of growth over the last five years.
Graph 1 compares regional contributions to growth in infrastructure work over the next decade with what has happened over the last five years. Since 2010, infrastructure spending in Canterbury has expanded by almost the same amount as nationwide activity – a clear legacy of the 2011 quakes. Growth in Auckland and Wellington over the last five years has been offset by contracting activity around the rest of the North Island – most notably Waikato and Taranaki.
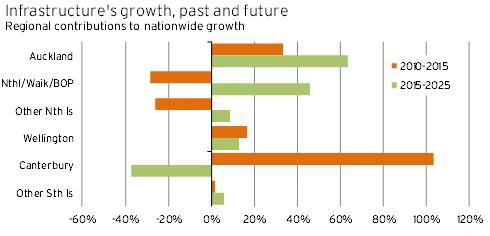
More detailed examination of our data shows that the completion of new power stations and an end to major National Grid upgrades by Transpower since 2010 are behind the drop-off in activity in Waikato. Looking forward, increased roading activity will contribute almost 60% of the lift in infrastructure spending in Auckland over the next decade, and a massive 93% of the rise in Waikato. Spending by local authorities on water and wastewater networks in Auckland and Northland will also lift significantly, and investment in electricity distribution networks in Bay of Plenty will also make a sizable contribution to growth in that region.
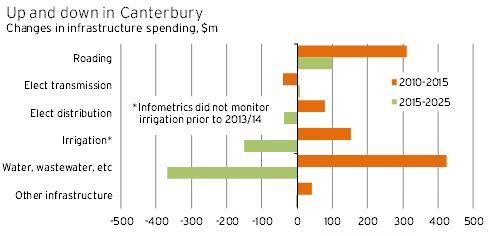
Graph 2 shows that the forecast decline in infrastructure spending in Canterbury over the next decade is a function of reduced spending on water and wastewater networks and a drop-off in planned irrigation projects. Roading is the one key infrastructure area in the region that is expected to enjoy further increases in investment from current levels.
Our Infrastructure Pipeline Profile provides detailed information about planned infrastructure investment broken down into infrastructure types and the geographic spread of activity. One of the key messages from the Profile is that the top half of the North Island needs to be a clear focus for firms involved in the provision and construction of new infrastructure. Another conclusion is the heavy emphasis on roading over the next decade given current central and local government policy settings. Nevertheless, these two results barely scratch the surface of the wealth of information we have compiled on the outlook for infrastructure activity.
If you’d like to find out more, please contact Shaun Twaddle (shaunt@infometrics.co.nz).